What Drives the Price of a Fruit Juice Wastewater Treatment Plant in 2026
A fruit juice wastewater (FJW) treatment plant in 2026 costs between $280,000 and $4.5 million in CAPEX depending on capacity, with OPEX adding $0.18–$0.95 per m³ treated. Small packaged systems (10–50 m³/day) run $280K–$650K, mid-scale plants (100–500 m³/day) $650K–$2.2M, and full-scale facilities (500–2,000 m³/day) $2.2M–$4.5M (source: HydropureWater project database, 2026). These brackets are anchored to the food-processing $1,800–$5,000 per m³-of-daily-capacity benchmark, multiplied by roughly 1.4× to account for FJW's higher organic and solids load versus typical food waste (source: cost-of-building-plants data, 2025-11).
Four variables swing the quote more than any other. First, influent strength: FJW routinely tests at COD 3,000–15,000 mg/L, with total suspended solids in the 1,500–4,000 mg/L range and pH 3.5–5.5 (Springer 2022, Top 3). Second, daily flow: a useful rule of thumb is that every litre of finished juice generates about 10 L of wastewater (Springer 2022, Top 3), so a 50 m³/day juice line produces roughly 500 m³/day of treatable effluent. Third, the discharge target: municipal sewer limits are loose compared to surface-water or reuse standards, and the polish stage can add $300K–$900K. Fourth, the automation level: PLC-controlled skid-mounted plants cost 15–25% more upfront than relay-logic systems but save 20–30% on labor OPEX over five years.
The FJW character forces several non-obvious costs. Low nitrogen and phosphorus — typically 20–80 mg/L N and 5–20 mg/L P — mean the biological stage cannot run on indigenous nutrients alone; urea and phosphoric acid dosing adds 15–20% to chemical OPEX. The low pH requires NaOH for neutralization before any biological reactor, and the high temperature of the effluent (30–40°C coming off CIP and pasteurizer drains) is actually an asset for mesophilic anaerobic reactors, which is why UASB and IC reactors dominate the high-load bracket.
| Cost Driver | Typical Range for FJW | Cost Impact |
|---|---|---|
| Influent COD | 3,000–15,000 mg/L | Higher COD → larger anaerobic reactor, thicker membranes |
| Daily flow | 10–2,000 m³/day | Drives reactor volume, blower sizing, footprint |
| Discharge target | Sewer / surface water / reuse | Reuse adds RO polish ($300K–$900K) |
| Automation | Relay / PLC / SCADA | PLC adds 15–25% CAPEX, cuts 20–30% labor OPEX |
The Process Train: How Each Stage Adds to the Price
A 500 m³/day FJW plant breaks down into five process blocks, each carrying a predictable share of the total CAPEX. Treating the vendor quote as a line-by-line document — not a black-box number — is the fastest way to challenge a bid.
1. Pretreatment (8–15% of CAPEX). Rotary bar screens remove fruit skins, seeds, and pulp fibers before the stream hits any biological system; a rotary bar screen sized for 50–300 m³/h handles most juice lines. Dissolved air flotation (DAF) follows for fats, oils, grease (FOG), and emulsified solids — a DAF system for fruit juice wastewater pretreatment typically removes 60–90% of FOG and 40–70% of TSS in a single pass and runs in the 4–300 m³/h capacity range. Skipping this stage is the most common reason downstream MBR membranes foul in under 12 months.
2. Equalization and pH correction (5–8% of CAPEX). FJW pH swings between 3.5 and 5.5; without a 6–24 hour equalization tank and an automatic chemical dosing system for NaOH (and trace nutrients), the pH shock will kill biomass in the downstream reactor within days. Equalization also smooths the 3–5× flow swings typical of batch CIP cycles.
3. Primary biological stage — anaerobic UASB or IC (25–40% of CAPEX). For FJW with influent COD above 3,000 mg/L, an upflow anaerobic sludge blanket (UASB) or internal circulation (IC) reactor delivers 75–90% COD removal at mesophilic temperatures, with hydraulic retention times of 12–48 hours. The biogas offset is material: every 1 kg of COD removed produces about 0.35 m³ of methane (Springer 2017, Top 1), and a 500 m³/day plant at 8,000 mg/L COD generates roughly 700 m³ CH₄/day — worth $80–$120/day at typical industrial gas prices.
4. Secondary biological stage — SBR or MBR (20–35% of CAPEX). Where the discharge target allows, a sequencing batch reactor (SBR) is the lowest-cost polish; an MBR membrane bioreactor for juice wastewater polishing drives effluent to COD under 50 mg/L and TSS under 5 mg/L, which is essentially reuse-ready. MBR costs $400K–$1.2M more than conventional activated sludge for a 500 m³/day plant, but the smaller footprint and stable effluent usually pay back inside 3–4 years if reuse offsets potable water purchases.
5. Polishing and disinfection (5–12% of CAPEX). A chlorine dioxide generator in the 50–20,000 g/h capacity range handles final microbial control for surface-water discharge; ozone is the alternative for plants targeting reuse where chlorine residuals would damage RO membranes downstream.
| Process Stage | Equipment | CAPEX Share | Key Performance |
|---|---|---|---|
| Pretreatment | Bar screen + DAF | 8–15% | 60–90% FOG, 40–70% TSS removal |
| Equalization | EQ tank + chemical dosing | 5–8% | Smooths 3–5× flow swings, corrects pH 3.5–5.5 |
| Anaerobic | UASB / IC | 25–40% | 75–90% COD removal, biogas 0.35 m³ CH₄/kg COD |
| Aerobic / MBR | SBR or MBR | 20–35% | COD <50 mg/L, TSS <5 mg/L with MBR |
| Disinfection | ClO₂ or ozone | 5–12% | Coliform reduction to <1,000 CFU/100 mL |
CAPEX by Plant Capacity: 2026 Price Table
Procurement managers usually arrive at a vendor quote with a daily flow number and walk out with a number they cannot verify. The table below maps the typical 2026 CAPEX range against flow, process train, footprint, and delivery lead time. The $1,800–$5,000 per m³-of-daily-capacity food-processing benchmark, multiplied by ~1.4× for FJW's higher load, is the underlying logic (source: cost-of-building-plants data, 2025-11). The largest bracket is cross-checked against the $5–$10M packaged MBR pricing for a 0.5 MGD (~1,900 m³/day) plant cited in the same source.
For very small producers under 50 m³/day, containerized systems like the compact package plant for small juice producers (WSZ series, 1–80 m³/h) cut civil work cost by 40–60% versus a stick-built installation, but cap at roughly 1,500 m³/day before logistics and membrane surface area become uneconomical.
| Daily Flow | CAPEX (USD, 2026) | Typical Process Train | Footprint | Lead Time |
|---|---|---|---|---|
| <10 m³/day | $120K–$280K | Package DAF + SBR + ClO₂ | 20–40 m² | 6–10 weeks |
| 10–50 m³/day | $280K–$650K | Bar screen + DAF + EQ + SBR/MBR | 60–150 m² | 8–12 weeks |
| 100–500 m³/day | $650K–$2.2M | DAF + EQ + UASB + MBR + ClO₂ | 200–800 m² | 12–20 weeks |
| 500–1,000 m³/day | $2.2M–$3.4M | DAF + EQ + IC + MBR + ClO₂ + sludge press | 800–1,800 m² | 16–28 weeks |
| 1,000–2,000 m³/day | $3.4M–$4.5M | DAF + EQ + IC + MBR + RO + ClO₂ | 1,800–3,500 m² | 24–40 weeks |
Anaerobic vs Aerobic: Which Process Choice Saves Money for Fruit Juice
The single biggest process decision — and the one that swings the lifecycle cost most — is whether to put an anaerobic front-end ahead of the aerobic polish or run an aerobic-only train. The decision rule is straightforward: if influent COD exceeds 4,000 mg/L and daily flow exceeds 100 m³/day, anaerobic front-end wins on 5-year lifecycle cost almost every time (HydropureWater field data, 2026). Below those thresholds, SBR or MBR alone is usually cheaper to install and operate, because the civil and gas-capture infrastructure for a UASB does not pay back at small scale.
UASB and IC reactors handle FJW particularly well because the influent temperature (30–40°C) sits in the mesophilic optimum, and the high carbohydrate content feeds methanogens efficiently. Reference designs in the literature include two-stage anaerobic hybrid + SBR configurations (Springer 2017, Top 1) and single-stage purple non-sulfur bacteria systems achieving >85% COD removal while producing single-cell protein as a byproduct (Springer 2022, Top 3). For most commercial juice plants, the UASB + MBR combination remains the lowest-risk, lowest-OPEX path.
OPEX differences are significant. An anaerobic-heavy train runs $0.18–$0.45/m³; an MBR-only aerobic train runs $0.55–$0.95/m³; conventional activated sludge sits between at $0.40–$0.70/m³. Biigas utilization is the swing factor: a 500 m³/day plant at 8,000 mg/L COD produces ~700 m³ CH₄/day, which offsets $80–$120/day in natural gas or grid electricity depending on how it is captured and burned.
| Process Choice | Influent COD | Flow Threshold | OPEX Range | Best Use Case |
|---|---|---|---|---|
| Anaerobic (UASB/IC) + MBR | >4,000 mg/L | >100 m³/day | $0.18–$0.45/m³ | Citrus, apple, concentrate plants with high COD |
| SBR only | 1,500–4,000 mg/L | <500 m³/day | $0.40–$0.70/m³ | Beverage dilutions, low-load juice lines |
| MBR only | 1,000–4,000 mg/L | Any | $0.55–$0.95/m³ | Tight reuse targets, small footprint sites |
| Anaerobic pond + wetland | 2,000–6,000 mg/L | >200 m³/day | $0.20–$0.40/m³ | Tropical climate, non-potable discharge only |
OPEX Breakdown and 5-Year Total Cost of Ownership
CAPEX is the number vendors lead with; OPEX is the number that determines whether the project pencils out. For a mid-scale FJW plant (200–500 m³/day), OPEX components break down roughly as follows: electricity 35–45% (dominated by blowers, transfer pumps, and MBR aeration), chemicals 15–20% (NaOH for pH correction, urea and phosphoric acid for nutrient dosing, coagulants for DAF), sludge hauling 15–25%, labor 10–20%, and membrane replacement 5–10% (source: HydropureWater operating data, 2026).
Cross-check: the cost-of-building-plants data puts conventional treatment at $6.50–$10.50 per gallon ($1.72–$2.78 per m³) and natural systems at $0.80–$1.50 per gallon ($0.21–$0.40 per m³); FJW plants with a UASB front-end typically sit between these two ranges, which lines up with the $0.18–$0.95/m³ band cited above (source: cost-of-building-plants, 2025-11).
The 5-year total cost of ownership simplifies to: TCO = CAPEX + 5 × annual OPEX + 1 × membrane replacement cycle. The membrane replacement cycle alone runs $80K–$300K depending on MBR size — this line is often missing from vendor quotes and is the first place a 5-year forecast goes wrong. Adding a filter press for fruit juice wastewater sludge dewatering the waste activated sludge and DAF float to roughly 20% moisture cuts hauling volume by 75–80% and is usually the single fastest OPEX win available, paying back in 12–24 months on sludge-disposal savings alone. A high-efficiency sedimentation tank upstream of the press further reduces sludge volume and improves cake solids.
Discharge Compliance: How the Effluent Target Moves the Final Price
The polish stage is where vendor quotes balloon — and where the most defensible engineering argument lives. Three regulatory regimes cover most juice plant projects in 2026.
China GB 8978-1996, second-class standard: COD <150 mg/L, BOD <30 mg/L, SS <150 mg/L, pH 6–9. Achievable with SBR + clarifier; no MBR or RO needed. This is the lowest-cost compliance path for plants discharging to a municipal sewer with a working treatment plant downstream.
EU Directive 91/271/EEC for food plants: COD <125 mg/L, BOD <25 mg/L, TSS <35 mg/L, total nitrogen 15 mg/L. The TN limit almost always forces MBR (or SBR with explicit denitrification) and a nutrient-dosing package.
EPA 40 CFR 407 (Fruit and Vegetable Processing): for new sources, BOD₅ ≤ 56 mg/L average daily, TSS ≤ 61 mg/L average daily. Achievable with biological treatment + clarifier, but discharge-to-water-body targets often require additional nutrient removal.
Reuse targets — cooling tower make-up, boiler feed, irrigation, or process water — drop the COD ceiling below 50 mg/L and total dissolved solids below 500 mg/L, which triggers an RO system for juice plant water reuse. For a 500 m³/day reuse loop, the RO skid alone runs $300K–$900K and consumes 1.5–2.5 kWh/m³ in energy, but recovers 75–85% of the polished MBR permeate as reusable water.
How to Read a Vendor Quote: 7 Line Items That Should Be There
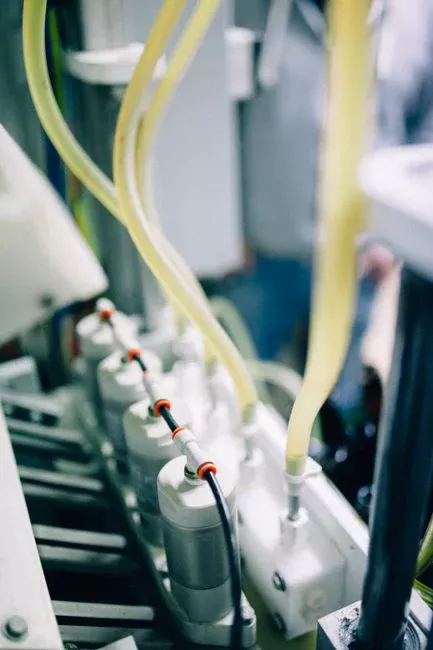
A defensible 2026 quote on a juice plant treatment system should contain at least these seven line items: (1) equipment (tanks, pumps, blowers, membranes, instrumentation), (2) instrumentation and control (pH, DO, MLSS, flow meters, PLC panel), (3) installation labor, (4) civil works (foundations, pipe racks, electrical), (5) commissioning and startup, (6) operator training, and (7) warranty/service for 12–24 months. The line items should be itemized — not lumped under a single "system" number — because every line is a negotiation lever.
Red flags in a quote: no influent assumption stated (ask for the design COD, BOD, TSS, FOG, pH, temperature, and flow profile the price was built on); no guaranteed effluent quality (a vendor should commit to specific numbers with consequences for non-performance); no membrane-replacement cost in the OPEX estimate; and no sludge-disposal line item (sludge handling is 15–25% of OPEX and is often quietly excluded). One additional check: a serious vendor will offer 3 reference sites in the same sub-industry — citrus, apple, concentrate, or beverage — because FJW character varies enough that a brewery reference is not equivalent.
Skid-mounted, factory-tested units with PLC pre-wiring cut site installation time by 30–50% versus field-assembled systems, and reduce the risk of late-stage surprises during commissioning. For plants with tight 2026 production schedules, that compression alone can justify a 5–10% CAPEX premium versus a stick-built quote.
Frequently Asked Questions
How much does a 100 m³/day fruit juice wastewater plant cost? A 100 m³/day FJW plant falls in the lower end of the mid-scale bracket, typically $650K–$1.1M for an anaerobic + MBR train. The 1.4× load multiplier versus municipal wastewater reflects FJW's higher COD and solids; the same flow of municipal sewage at typical strength would price 30–40% lower (source: cost-of-building-plants benchmark, 2025-11).
What influent COD is typical for fruit juice wastewater? FJW typically tests at COD 3,000–15,000 mg/L, with citrus concentrate and apple juice plants at the higher end and beverage dilutions at the lower end (Springer 2022, Top 3). Seasonal swings are large: a citrus campaign plant can run 12,000–15,000 mg/L during pressing season and 2,000–3,000 mg/L during off-season cleaning, which is why equalization is non-optional.
Can fruit juice wastewater be treated for reuse? Yes. MBR + RO routinely achieves 75–85% water recovery at reuse quality. The MBR drives COD below 50 mg/L and TSS below 5 mg/L; the RO polishes TDS below 500 mg/L. The added polish cost is $300K–$900K for a 500 m³/day RO skid, with energy at 1.5–2.5 kWh/m³ — payback depends on local potable water tariffs and the volume of process water the plant can substitute.
What is the cheapest fruit juice wastewater treatment method? An anaerobic pond followed by a constructed wetland runs $0.20–$0.40/m³ in OPEX and is viable in tropical and subtropical climates with non-potable discharge limits. It is not appropriate in cold regions (anaerobic activity stalls below 15°C) and cannot meet tight surface-water or reuse standards.
How long does a fruit juice wastewater plant take to build? Packaged systems under 50 m³/day typically ship in 6–10 weeks and are commissioned within 3–4 weeks of arrival. Mid-scale civil-built plants (100–500 m³/day) run 10–16 months from PO to startup. Full-scale facilities (500–2,000 m³/day) with RO polishing run 16–24 months, dominated by civil works, tank fabrication, and the RO skid lead time.