Why HF Etching Wastewater Is Its Own Treatment Problem
F⁻ discharge caps have fallen 30–60% across the top fab and PV manufacturing regions since 2022, with 2026 surface-water permits in the EU now commonly written at 8–10 mg/L total fluoride and Chinese GB 8978 indirect-discharge limits at 10–15 mg/L (per EU and China GB 8978, 2026). HF etching wastewater is not a generic strong-acid stream: it carries free F⁻, undissociated HF that volatilizes below pH 2, colloidal SiO₂ from glass and oxide removal, and process complexants (per VSEP description of HF wafer-cleaning streams). Designing it as "just acid neutralization" is the single most common cause of failed 2024–2025 RFQs, because lime alone leaves 10–25 mg/L F⁻ in the overflow and generates more CaF₂ sludge than the budget allows. Three constraints drive every decision that follows: fluoride chemistry (not pH alone), solids/silica handling that protects downstream membranes, and the choice between discharge polishing and a full ZLD train driven by rising fab water-reuse targets.
Influent Characterization: What Is Actually in HF Etching Wastewater
Glass-etching, solar/PV texturing, and semiconductor wet-etch streams share a common envelope but differ enough that the reactor volume and reagent dose must be sized to the actual stream, not a textbook average. F⁻ typically lands between 500 and 10,000 mg/L, pH runs 1–3, and total suspended solids span 200–2,000 mg/L from resist residue, glass fines, and abraded wafer particles. The parameters below reflect typical low/mid/high ranges observed across these three sectors (HydropureWater field data, 2025–2026):
| Parameter | Glass etching (low) | Solar/PV (mid) | Semiconductor (high) |
|---|---|---|---|
| Total F⁻ (mg/L) | 500–1,500 | 1,500–4,000 | 4,000–10,000 |
| pH | 2.0–3.0 | 1.5–2.5 | 1.0–2.0 |
| COD (mg/L) | 50–200 | 100–400 | 200–800 |
| TSS (mg/L) | 200–600 | 500–1,200 | 800–2,000 |
| SiO₂ dissolved (mg/L) | 50–150 | 100–300 | 150–450 |
| Conductivity (mS/cm) | 2–6 | 5–15 | 10–30 |
| NH₄⁺ (mg/L) | <20 | 20–80 | 50–200 |
| Heavy metals (As, Pb, mg/L) | <1 | 1–5 | 2–15 |
SiO₂ colloids matter because they complex free F⁻, slow CaF₂ precipitation kinetics, and blind UF/RO membranes downstream (per VSEP note on colloids destabilizing HF wastewater membranes). HF partial pressure becomes a real ventilation and material-of-construction driver below pH 2, which forces closed reactors in PE, PP, or FRP rather than open concrete basins. F⁻ speciation drifts within hours of sampling, so on-site electrode analysis or preserved grab samples are mandatory; a lab F⁻ value 6 hours after collection is not a valid design basis.
The Canonical HF Etching Wastewater Treatment Process Flow
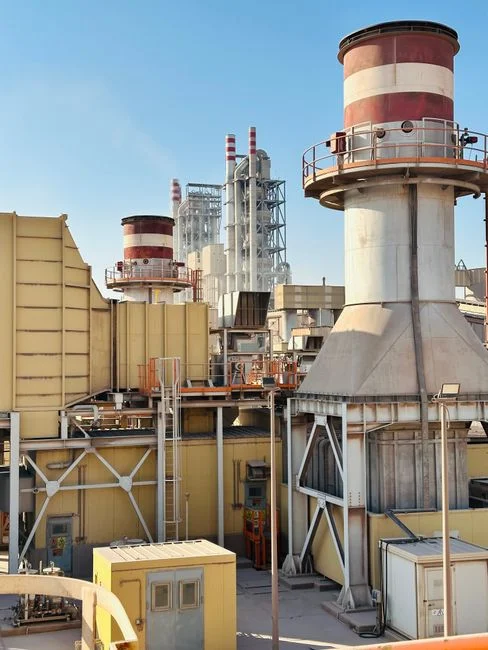
A modern hydrofluoric acid etching wastewater treatment process is a multi-stage train: equalization → pH adjustment → calcium-based precipitation of fluoride as CaF₂ (Ksp ≈ 3.9×10⁻¹¹) → coagulant/flocculation → sedimentation or DAF → polishing via adsorbent, ion exchange, or membrane (UF/RO) → optional ZLD. Two-stage Ca(OH)₂ neutralization, as engineered by Kurita, reliably drives residual fluoride below 10–15 mg/L before polishing to sub-1 mg/L reuse or discharge limits. Target values at each gate, used to benchmark vendor proposals:
| Stage | Equipment | Key control | Target leaving gate |
|---|---|---|---|
| 1. Equalization & pH pre-condition | PE/FRP EQ tank, mixer | pH 2.0–2.5, 8–24 h HRT | Homogenized, HF suppressed |
| 2. Primary Ca(OH)₂ precipitation | Stirred reactor, slurry feed | pH 7.0–8.5, Ca:F 0.5–0.7 mol, 30–60 min, 20–40 rpm | F⁻ <50 mg/L, TSS <200 mg/L |
| 3. Coagulation/flocculation | PAC + PAM dosing skid, slow mix | PAC 20–80 mg/L, PAM 1–3 mg/L | Colloidal SiO₂ and fine CaF₂ captured |
| 4. Solid-liquid separation | lamella clarifier for CaF₂ settling or DAF system for fluoride-laden wastewater | Surface load 1–3 m/h (lamella), 5–10 m/h (DAF) | TSS <30 mg/L, F⁻ 10–15 mg/L |
| 5. Polishing | Activated alumina / ion exchange / UF + RO | Bed velocity 5–10 BV/h, UF 0.1 μm PVDF | F⁻ 1–5 mg/L (adsorbent), <1 mg/L (RO permeate) |
| 6. Optional ZLD | High-recovery RO, brine concentrator, crystallizer | Recovery ≥90%, SDI <3 feed | Water reuse ≥90%, salt cake to disposal |
Stage 1 lifts pH to 2.0–2.5 with NaOH or dilute lime slurry to suppress HF volatility before any Ca addition; adding Ca(OH)₂ directly to pH <2 wastes reagent and drives off HF gas. Stage 2 doses Ca(OH)₂ slurry to pH 7.0–8.5 with a stoichiometric Ca:F molar ratio of 0.5–0.7 (1.0–1.4× stoichiometric), targeting F⁻ <50 mg/L via CaF₂ over 30–60 min at 20–40 rpm (based on Kurita two-stage Ca(OH)₂ process disclosed in the Patsnap report). Stage 3 adds polyaluminum chloride (PAC) or polyacrylamide flocculant to capture colloidal silica and fine CaF₂ that escape the clarifier, per CN103159342B and academic studies on PAC coagulation for HF wastewater. Stage 6 typically uses brackish-water RO or VSEP vibrating RO for ≥90% water recovery, followed by a brine concentrator and crystallizer for salt cake (per VSEP description of high-recovery RO/VSEP systems for HF streams). Use a PLC-controlled Ca(OH)₂ and PAC dosing skid to keep pH and reagent ratio inside the Stage 2 control band.
Fluoride Removal Chemistry: Calcium vs. Aluminum vs. Magnesium vs. Membrane
Choosing the polishing chemistry is where 2026 HF etching lines either meet reuse targets or pile up sludge. The four credible options, head-to-head:
| Chemistry / technology | Achievable residual F⁻ | Sludge yield | Reagent cost index (lime = 1.0) | Best-fit case |
|---|---|---|---|---|
| Ca(OH)₂ or CaCl₂ precipitation (CaF₂, Ksp 3.9×10⁻¹¹) | 10–15 mg/L | ~2.2 kg dry CaF₂ per kg F⁻ removed | 1.0 (baseline) | Primary step, discharge-to-sewer |
| PAC / Al₂(SO₄)₃ coagulation | 2–8 mg/L | ~1.5–2.0 kg Al(OH)₃ + co-precipitate per kg F⁻ | 1.8–2.5 | Secondary polish, colloidal SiO₂ removal |
| MgCl₂ / MgO precipitation (Mg(OH)₂F, MgF₂) | <1 mg/L | ~1.8 kg Mg(OH)₂ sludge per kg F⁻ | 4.0–6.0 | Strict reuse limits, sub-1 mg/L F⁻ |
| Membrane polishing (UF + RO, or VSEP) | <0.5 mg/L (permeate) | Brine reject 5–15% of feed | 2.5–4.0 (membrane + energy) | Reuse / ZLD, requires SDI <3 feed |
Calcium is the workhorse and always belongs in Stage 2; it has the lowest reagent cost but generates the most CaF₂ sludge by mass. Aluminum coagulation (PAC) is the standard polish after lime because it drops F⁻ to 2–8 mg/L while pulling colloidal silica — a single reagent doing two jobs. Magnesium drives F⁻ below 1 mg/L as Mg(OH)₂F or MgF₂ but costs roughly 4–6× lime, so it is reserved for sites where reuse water demands very low F⁻. Membrane polishing delivers sub-1 mg/L F⁻ and reusable permeate but tolerates only Silt Density Index (SDI) below 3 feed and is sensitive to silica scaling above 150 mg/L SiO₂ in the reject. For ZLD configurations, an industrial RO system for fluoride polishing preceded by a multi-media filter protecting downstream RO (plus UF in higher-TSS streams) is the standard 2026 architecture. When a tighter biological or organic load is present upstream, an MBR stage can be inserted before RO to drop COD and TSS together.
CaF₂ Sludge Handling: The Hidden CAPEX Driver
Sludge dewatering and disposal typically decides the project budget before the reactors do. Mass balance for a 50 m³/d stream at 2,000 mg/L F⁻: about 100 kg/d of F⁻ is precipitated, generating roughly 220 kg/d of dry CaF₂ cake plus bound water — 80–120 tonnes of filter cake per year at 65% moisture. CaF₂ is a non-hazardous industrial waste in most jurisdictions when F⁻ leachate (TCLP, Toxicity Characteristic Leaching Procedure) is below 50 mg/L, but 2026 disposal tipping fees run USD 60–180/t depending on region and fluoride-leachate class. A filter press for CaF₂ sludge dewatering is the right tool for low-volume, high-solids CaF₂; automatic plate-shifting and cloth-wash cycles keep cake moisture below 65% and throughput predictable. Several 2026 vendors offer Ca(OH)₂ recovery from CaF₂ via acid digestion, but the economics only close at flows above ~200 m³/d where the acid cost is offset by reagent resale — below that, landfill or cement-kiln co-disposal remains the default.
2026 CAPEX & OPEX Benchmarks for an HF Etching Wastewater Line
Procurement needs normalized numbers to compare RFQ responses. The table below reflects 2026 turnkey pricing for a discharge-polishing line (EQ → Ca precipitation → clarifier/DAF → adsorbent polish), without ZLD unless noted (HydropureWater 2026 budget data, normalized):
| Capacity | CAPEX (USD) | OPEX (USD/m³ treated) | Dominant OPEX line |
|---|---|---|---|
| 10 m³/d | 90,000–180,000 | 2.5–4.0 | Ca(OH)₂ reagent (45–55%) |
| 50 m³/d | 280,000–650,000 | 1.8–3.0 | Ca(OH)₂ reagent (40–50%), sludge disposal (15–25%) |
| 200 m³/d | 1,100,000–2,400,000 | 1.5–2.5 | Ca(OH)₂ (40–50%), sludge (15–25%), RO membrane replacement (10–20% if ZLD) |
| ZLD adder (any size) | +1.8–2.5× CAPEX | +0.8–1.5 | Energy (thermal crystallizer 30–45%) |
ZLD adders (RO plus brine concentrator plus crystallizer) typically multiply CAPEX by 1.8–2.5× but cut water purchase by 60–90%, which flips the economics in any region where fresh-water cost exceeds USD 1.5/m³. For a complementary ZLD cost frame on a related stream, see the phosphating ZLD engineering guide; for influent and reuse targets on a fluoride-adjacent line, the solar-cell fluoride wastewater treatment guide benchmarks influent F⁻ at the upper end of the envelope above.
Selecting the Right Treatment Train: Discharge vs. Reuse vs. ZLD
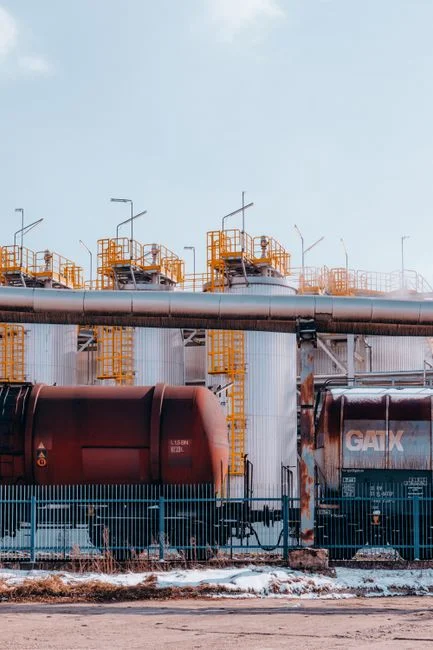
Three reference trains cover the 2026 buying decision. Discharge-to-sewer at <15 mg/L F⁻: equalization → Ca(OH)₂ precipitation → DAF or lamella clarifier → pH trim; lowest CAPEX, no membrane hardware, sludge disposal is the only recurring cost. Discharge-to-surface-water at 8–10 mg/L F⁻: the sewer train plus PAC coagulation and an activated-alumina polish; mid CAPEX, the adsorbent step drives OPEX up by about USD 0.4–0.7/m³. Water reuse or ZLD: add UF plus RO (or VSEP) and brine crystallization; highest CAPEX but lowest water purchase and the lowest discharge-permit risk. Selection rule of thumb for 2026: choose reuse/ZLD when local water cost exceeds USD 1.5/m³ and discharge permit risk is high; otherwise discharge polishing is the default. Plants in the UAE and water-stressed Gulf states typically default to ZLD on this basis; for the regulatory anchor, see UAE heavy metals discharge limits.
Frequently Asked Questions
What pH is required before adding calcium to HF wastewater? Lift pH to 2.0–2.5 with NaOH or dilute lime slurry before any Ca(OH)₂ dosing; below pH 2, undissociated HF volatilizes, off-gasses, and wastes reagent.
How much Ca(OH)₂ is needed to remove fluoride? Dose 1.0–1.4× stoichiometric Ca:F molar ratio (0.5–0.7 mol Ca per mol F) to drive residual F⁻ below 15 mg/L via CaF₂ precipitation.
Can RO handle HF wastewater directly? No. UF pretreatment to SDI <3 is required, and CaF₂ precipitation must precede RO to avoid membrane scaling and irreversible fouling by colloidal silica and residual fluoride.
Is CaF₂ sludge hazardous? CaF₂ sludge is generally non-hazardous when TCLP F⁻ is below 50 mg/L; classification is case-by-case in the EU and China, and co-disposal in cement kilns is the common 2026 route.
What fluoride limit applies in 2026? 10–15 mg/L is the typical discharge cap (China GB 8978 indirect discharge, EU surface water), and sub-1 mg/L applies to RO permeate intended for reuse under most 2026 permits.