Solar cell manufacturing wastewater carries fluoride up to 2,000 mg/L—200× China’s GB 8978-1996 Class 1 limit of 10 mg/L. Hybrid zero liquid discharge (ZLD) trains that combine chemical precipitation, membrane filtration, and evaporation routinely reach 99.9% fluoride removal and support reuse. This article sets out engineering specs, cost ranges, and selection rules for solar cell fluoride streams at PV fabs.
Why Solar Cell Fluoride Wastewater Fails Compliance
Texturing and silane processes release HF-derived fluoride up to 2,000 mg/L against China’s GB 8978-1996 Class 1 limit of 10 mg/L. Untreated effluent accelerates corrosion, raises hazardous sludge volume, and triggers fines up to $50,000 per year. One 5GW Jiangsu mono-Si facility recorded about $200,000 in penalties over two years before ZLD startup.
Fluoride spikes come from wafer texturing baths that dose hydrofluoric acid (HF) together with nitric acid (HNO₃). Silane tower blowdown can add still more fluoride, often with elevated ammonia nitrogen as a co-contaminant. At 2,000 mg/L, the load sits 200 times above the 10 mg/L Class 1 limit (Solar Cell Wastewater Case Study, 2025). Enforcement can force production cuts or closure when exceedances persist.
Beyond fines, high-fluoride water attacks plant infrastructure, and fluoride toxicity guidance from EPA 2023 frames groundwater risk if leaks escape the sewer boundary. Most plants we size for 1–5GW mono-Si lines see the worst peaks on texturing dump cycles, not on steady rinse water. Stabilizing those dumps in an equalization tank is usually the first cheap process win before any membrane stage is purchased.
Operators also underestimate sludge handling. Calcium fluoride cake is often classified as hazardous waste, so disposal fees stack quickly when precipitation runs without thickening or filter-press dewatering. A compliance plan that only watches the 10 mg/L water number, and ignores sludge tickets and haulage fees, still fails the plant’s real cost model.
Fluoride Removal Mechanisms: Precipitation, Membranes, and Electrocoagulation
Chemical precipitation with calcium salts remains the workhorse for high fluoride. Calcium chloride (CaCl₂) or calcium hydroxide (Ca(OH)₂) at pH 8–10 forms insoluble CaF₂ and typically removes 90–95% of fluoride.
A Ca:F molar ratio of 1.5–2.0 and 30–60 minutes retention are the usual design points (US20140161714A1 patent).
Reverse osmosis polishes residual fluoride at 95–99% rejection when feed SDI stays below 3. Operating pressure is commonly 10–25 bar, and feed pH is held near 5–8 depending on the membrane. Without solid pretreatment, scaling and fouling cut flux fast on PV chemistry. For polishing and reuse, a dedicated RO system for fluoride polishing and water reuse usually follows precipitation.
Electrocoagulation (EC) with aluminum electrodes generates Al³⁺ that hydrolyzes to Al(OH)₃ flocs and adsorbs fluoride. Removal of 90–98% is typical at pH 6–8, with energy use of 0.5–1.2 kWh/m³ (2024 IEEE study). Electrode wear and secondary sludge are the standing OPEX penalties.
Plants comparing export packages sometimes review fluoride removal technologies in the eu when buyers ask for CE-aligned documentation, but the core unit ops stay the same.
Each path has a clear operating limit that shows up in the OPEX sheet. Precipitation creates CaF₂ sludge that is often classed as hazardous waste. RO struggles at high TDS without solid pretreatment.
EC trades chemical sludge for ongoing electrode wear and power cost. Field skids we audit rarely beat precipitation-plus-RO on dollars per kilogram of fluoride removed once influent stays above about 500 mg/L.
| Technology | Fluoride Removal Efficiency | Optimal pH Range | Key Operating Parameters | Primary Limitations |
|---|---|---|---|---|
| Chemical Precipitation (Calcium Salts) | 90–95% | 8–10 | Ca:F molar ratio 1.5–2.0, 30–60 min retention | High sludge generation, requires pH adjustment |
| Reverse Osmosis (RO) | 95–99% (post-treatment) | Feed pH 5–8 (membrane dependent) | SDI <3, pre-filtration, operating pressure 10-25 bar | Membrane fouling, high TDS rejection, high CAPEX/OPEX for membranes |
| Electrocoagulation (EC) | 90–98% | 6–8 | Energy 0.5–1.2 kWh/m³, electrode material (Al/Fe) | Electrode consumption, higher energy costs, secondary sludge |
How Is Fluoride Removal Performance Evaluated?
Fluoride removal performance is evaluated on effluent mg/L versus the permit, percent removal across each stage, and sludge or brine mass per cubic meter treated. For GB 8978-1996 Class 1, the hard gate is ≤10 mg/L fluoride in the final discharge, not a marketing percent figure alone.
Stage sampling should catch precipitation supernatant, clarifier overflow, RO permeate, and evaporator condensate. Most plants we commission hold precipitation effluent near <50 mg/L F⁻ before membranes, then RO permeate <5 mg/L F⁻ under SDI <3 feed. Track Ca:F molar ratio, pH within ±0.2, and energy kWh/m³ so cost and compliance move together.
Buyers running a BWT-style evaluation packet should also log chemical kg/m³, electrode life if EC is present, and membrane differential pressure trends. When sludge is sold or further processed, keep calcium fluoride production plant cost out of the treatment OPEX line so ROI math stays honest. Mix those ledgers and the 3–5 year payback story collapses.
Acceptance tests work best on a 24–72 hour performance campaign that includes at least one full texturing dump cycle. Grab samples miss the peak that trips the online fluoride probe overnight. If the online meter and lab wet chemistry disagree by more than about 10% relative near the 10 mg/L gate, recalibrate before signing performance certificates.
Step-by-Step Design: Hybrid ZLD System for 99.9% Fluoride Removal
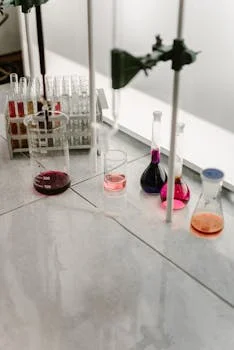
Hybrid ZLD design for solar PV fluoride waste starts with equalization (2–4 h HRT) so dumps and rinses blend before chemistry. Sodium hydroxide then lifts pH to 9.0–9.5.
Calcium chloride is dosed at about 1.5× stoichiometric fluoride so CaF₂ precipitation runs to completion in 30–60 minutes.
A lamella clarifier for fluoride sludge follows at 20–30 m³/m²·h surface loading, targeting TSS <30 mg/L. Where floatable solids dominate after coagulation, a Dissolved Air Flotation (DAF) System can replace or precede the settler for sludge separation. Clarified water then passes multi-media or carbon filtration before RO.
The RO system for fluoride polishing and water reuse is typically set for 75–85% recovery on this chemistry, with >98% fluoride rejection when SDI stays below 3. Permeate often lands below 5 mg/L F⁻ and returns to process.
RO reject feeds a forced-circulation evaporator at 0.02–0.04 kWh/kg water evaporated (2024 Saltworks data), then a crystallizer that yields salt cake plus condensate.
Dosing accuracy decides whether you hit 99.9% overall removal or bounce above the 10 mg/L gate. PLC-controlled chemical dosing for fluoride precipitation with 0.5–5 L/h pumps in 316SS keeps CaCl₂ and NaOH on setpoint when influent swings.
That dosing control loop is cheap relative to a single week of evaporator downtime.
Materials of construction matter on HF-exposed fronts. Use lined equalization and pH tanks, and keep elastomer selection compatible with residual fluoride and oxidants from nitric acid carryover.
On the brine side, forced-circulation evaporators are chosen because they tolerate scaling better than falling-film units on high-TDS PV reject. Most plants we size for run the evaporator at the lower end of the 0.02–0.04 kWh/kg band when steam or MVR power is priced carefully.
| Process Stage | Key Purpose | Engineering Specifications | Typical Outcome |
|---|---|---|---|
| Equalization Tank | Flow & quality homogenization | 2-4 hour hydraulic retention time (HRT) | Stable influent to next stage |
| pH Adjustment | Optimize precipitation | NaOH dosing to pH 9.0–9.5 | pH controlled within ±0.2 units |
| Chemical Precipitation | Fluoride removal (primary) | CaCl₂ @ 1.5× stoichiometric F, 30-60 min retention | Fluoride reduced to <50 mg/L |
| Lamella Clarifier | Solids-liquid separation | Surface loading rate 20–30 m³/m²·h | TSS <30 mg/L, concentrated sludge |
| RO System | Fluoride polishing, water reuse | Recovery 75–85%, SDI <3 feed, >98% fluoride rejection | Fluoride <5 mg/L, high-purity permeate |
| Forced Circulation Evaporator | Brine concentration | Energy 0.02–0.04 kWh/kg water evaporated | Concentrated brine for crystallization |
| Crystallizer | Solid waste recovery | Specific design based on salt type | Solid salt cake, high-quality condensate |
What Drives Water Treatment Plant Cost Breakdown?
Water treatment plant cost breakdown for a 100 m³/h hybrid ZLD serving a 5GW solar cell line typically lands at $1.2 million to $3.5 million CAPEX. Equipment is about 40%, installation and civil works 30%, engineering and project management 20%, and permitting 10%.
Those shares hold when the train includes dosing, RO, evaporator, and crystallizer.
OPEX usually sits at $0.80–$2.50 per cubic meter treated. Chemicals (CaCl₂, NaOH, antiscalants) contribute $0.30–$0.80/m³. Energy for the evaporator and RO pumps contributes $0.20–$1.00/m³ (2024 case study from Jiangsu).
Labor, hazardous sludge disposal, and scheduled maintenance fill the rest of the band.
Payback commonly falls in 3–5 years when reuse cuts freshwater demand by about 50% and avoided fines are counted. A plant avoiding $200,000 in annual fines and saving $150,000 on freshwater nets about $350,000 per year; against $1.5 million CAPEX that is roughly 4.3 years.
RO membranes are replaced every 3–5 years at $20,000–$50,000, and quarterly evaporator cleaning runs near $5,000 per year.
Cost drivers that push a quote to the high end of each band include peak F⁻, EC pretreatment, and hazardous-waste tipping fees. Crystallizer duty also matters: dry cake costs more than wet slurry handling. Power tariff and steam availability shift evaporator OPEX more than membrane power on true ZLD scopes. Keep liquid fluoride chemical purchase cost separate from wastewater treatment OPEX when finance teams ask for a “cost of liquid fluoride” line—those are different ledgers.
| Cost Category | Typical Range (100 m³/h ZLD) | Breakdown/Notes |
|---|---|---|
| CAPEX (Total) | $1.2M – $3.5M | |
| Equipment | 40% of CAPEX | Chemical dosing, RO, evaporator, crystallizer |
| Installation & Civil Works | 30% of CAPEX | Piping, tanks, foundations, electrical |
| Engineering & Design | 20% of CAPEX | Process design, P&IDs, project management |
| Permitting | 10% of CAPEX | Regulatory compliance, environmental impact assessment |
| OPEX (Per m³ Treated) | $0.80 – $2.50/m³ | |
| Chemicals | $0.30 – $0.80/m³ | CaCl₂, NaOH, antiscalants |
| Energy | $0.20 – $1.00/m³ | Evaporator, RO pumps, general power |
| Labor | $0.10 – $0.30/m³ | Operator salaries, maintenance staff |
| Sludge Disposal | $0.10 – $0.20/m³ | Hazardous waste disposal fees |
| Maintenance (Scheduled) | $0.05 – $0.10/m³ | Membrane replacement, spare parts |
| ROI (Payback Period) | 3 – 5 years | Via water reuse savings & avoided fines |
Procurement teams should request vendor curves for CaCl₂ dose versus influent F⁻, RO flux at the stated recovery, and evaporator economy at the design TDS. Without those curves, the $1.2M–$3.5M CAPEX band and the $0.80–$2.50/m³ OPEX band stay too wide for a bankable estimate.
Freeze peak dump volume early; it dominates equalization volume and chemical peak rate more than average daily flow.
Technology Selection Guide: Which Fluoride Treatment System Fits Your Facility?
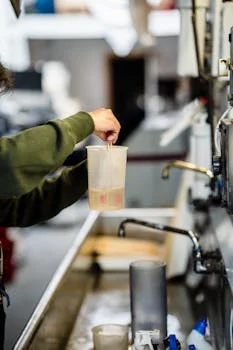
Technology selection for fluoride treatment hinges on flow, influent F⁻, and CAPEX band. Flows under 50 m³/h with moderate fluoride often stop at precipitation plus RO. Flows above 50 m³/h on 5GW-class sites usually need precipitation, RO, and evaporation to hit reuse or ZLD targets.
Concentration sets the front end. Below 500 mg/L F⁻, RO with strong pretreatment can be enough if other ions cooperate. From 500–2,000 mg/L—the common texturing band—precipitation then RO is the default. Above 2,000 mg/L, EC ahead of precipitation can cut chemical dose before the ZLD block.
Budget maps to scope. A $500,000–$1 million envelope may buy precipitation only, sometimes with DAF for solids, when discharge is the sole goal. A $2 million–$4 million envelope opens full ZLD with evaporator and crystallizer. Semiconductor fabs with lower flow but ultrapure reuse often add EDI after RO; solar cell plants with higher flow and moderate reuse purity stay on precipitation-RO hybrids.
Match the train to the decision you must defend in a design review. If local sludge landfills refuse CaF₂ cake, revisit precipitation chemistry or off-site processing contracts before locking P&IDs.
| Parameter | Scenario 1: Low Flow/Moderate F⁻ | Scenario 2: Moderate Flow/High F⁻ | Scenario 3: High Flow/Very High F⁻ / ZLD |
|---|---|---|---|
| Flow Rate | <50 m³/h | 50–150 m³/h | >150 m³/h |
| Fluoride Concentration | <500 mg/L | 500–2,000 mg/L | >2,000 mg/L |
| Target Outcome | Discharge compliance, some reuse | Strict discharge, significant reuse | ZLD, maximum water recovery |
| Recommended Technologies | Chemical Precipitation + RO | Chemical Precipitation + RO + Evaporation | Electrocoagulation + Chemical Precipitation + RO + Evaporation/Crystallizer |
| Typical CAPEX | $0.5M – $1.5M | $1.5M – $3M | $2.5M – $4.5M+ |
| Example Use Case | Smaller solar cell facility, initial compliance | Mid-size solar cell plant, expanding reuse | Large 5GW+ solar cell facility, full ZLD mandate |
Selection checklist: Confirm peak and average F⁻ mg/L from texturing dumps. Set design flow in m³/h including batch discharges. Choose discharge, reuse, or ZLD as the target.
Define sludge classification and the disposal route. Lock the CAPEX band, evaporator power price, and the pretreatment path that holds SDI below 3.
Operating Limits and Common Failure Modes
Hybrid fluoride trains fail most often at process interfaces, not inside one well-tuned unit alone. Precipitation that leaves >50 mg/L F⁻ overloads RO scaling potential even when SDI looks acceptable. Clarifier carryover above about 30 mg/L TSS blinds cartridge filters within days on texturing dumps.
RO recovery pushed past 85% on this chemistry usually forces antiscalant dose up and shortens membrane life below the 3–5 year replacement interval used in the cost model. Evaporators see rapid fouling when RO pretreatment is skipped “to save CAPEX.” That trade almost always costs more in cleaning chemicals and lost runtime than the filters would have.
Instrument drift near the 10 mg/L gate is another quiet failure. Online fluoride probes need routine calibration against lab methods during dump events, not only during steady rinse flow. Plants that sample only day-shift grab composites often pass audits and still trip night-shift peaks.
Sludge handling deserves equal design time. CaF₂ cake that leaves the clarifier at low solids multiplies haulage cost inside the $0.10–$0.20/m³ disposal band.
A filter press or thickener after the lamella or DAF stage is usually cheaper than buying a larger crystallizer to “solve” a solids problem that started upstream.
For ammonia-nitrogen co-contamination from silane towers, do not assume the fluoride ZLD block removes NH₃-N to permit. Strip, breakpoint chlorination, or a dedicated biological step may sit beside the fluoride train. Mixing those scopes in one CAPEX line hides the true water treatment plant cost breakdown during EPC bidding.
Who This Is For / Next Step
PV process engineers, EPC firms, and procurement teams sizing fluoride treatment for solar cell fabs are the primary readers. Municipal drinking-water defluoridation projects and chip fabs that need ultrapure EDI-only reuse should use a different design basis. To size a train against your flow and F⁻ peaks, send parameters through our request a project quote form with dump volume, peak F⁻, and reuse target stated.
Frequently Asked Questions
What are the primary sources of fluoride in solar cell manufacturing wastewater?
Fluoride mainly comes from wafer texturing that uses hydrofluoric acid (HF) with nitric acid (HNO₃). Silane tower wastewater can add more fluoride and often carries ammonia nitrogen as well. Those streams commonly exceed the 10 mg/L GB 8978-1996 Class 1 limit and need staged treatment before discharge or reuse.
How does a hybrid ZLD train meet GB 8978-1996 fluoride limits?
A hybrid ZLD train meets GB 8978-1996 by stacking precipitation, RO, and evaporation. Calcium dosing at pH 9–10 removes bulk fluoride, RO polishes residual ions, and the evaporator/crystallizer locks brine into solids. Plants following this path routinely hold final fluoride below 10 mg/L and often below 1 mg/L in permeate or condensate streams.
What is the role of a lamella clarifier in fluoride wastewater treatment?
A lamella clarifier separates dense CaF₂ sludge after precipitation by expanding settling area with inclined plates. Typical surface loading is 20–30 m³/m²·h with TSS targets near <30 mg/L. Keeping solids out of the RO feed protects membranes and preserves the 75–85% recovery window used on fluoride wastewater.
Can a ZLD system for solar cell wastewater also handle phosphorus?
Yes. Precipitation chemistry can add iron or aluminum salts when phosphorus is present, while RO and evaporation still strip a broad dissolved-solids load. The same ZLD skeleton used for fluoride therefore extends to multi-contaminant PV effluent, as outlined in phosphorus removal in solar cell wastewater.
What are the benefits of water reuse in solar cell manufacturing facilities?
Water reuse commonly cuts freshwater demand by about 50% or more when RO permeate and evaporator condensate return to process. That saving, plus avoided non-compliance penalties, is why many 100 m³/h ZLD projects show 3–5 year payback. Practical reuse layouts for PV plants are covered in water reuse strategies for solar cell wastewater.