Why Rubber Processing Wastewater Is Unusually Difficult to Treat
Rubber processing wastewater combines four separate effluent streams into a single high-strength feed, and each stream attacks a different weakness of conventional biology. Latex serum from concentrate plants carries 5,000–8,000 mg/L COD with a BOD₅/COD ratio that drops below 0.30 once ammonia and short-chain organic acids dominate. Coagulation bath overflow (formic or acetic acid) drives pH to 3.5–5.0 and carries residual ammonia at 50–150 mg/L. Washing water and equipment cleaning add 1,500–4,000 mg/L suspended solids, plus fiber and rubber scrap. Scrubber blowdown from carbon black and oil mist handling contributes sulfide at 20–100 mg/L, originating from sulfur-vulcanized natural rubber breakdown.
Municipal-grade biology cannot handle this profile. The combined effluent sits at 3,000–8,000 mg/L COD and 1,500–4,000 mg/L TSS, with sulfide toxicity inhibiting methanogens and nitrifiers, temperature shocks of 10–15 °C between batch wash cycles, and a biodegradable fraction that is only fully accessible after sulfide stripping and pH correction. Field experience across natural rubber and latex processing operations shows that single-stage aerobic systems fail at 60–80% COD removal, whereas a correctly designed four-stage train reaches 95–99% removal and produces reuse-quality or compliant effluent.
Typical Influent Characterization for Natural Rubber and Latex Plants
Design starts with a defensible influent envelope. The table below consolidates typical ranges observed across NR latex concentrate, ribbed smoked sheet (RSS), and latex glove processing lines, drawn from published studies and operating data through 2025-12. Peak-to-average flow ratios in these facilities routinely run 2.0–3.0×, so equalization must be sized to the peak band, not the daily mean.
| Parameter | Unit | Typical Range | Design Peak |
|---|---|---|---|
| pH | — | 4.0–7.5 | 3.5–8.5 |
| COD | mg/L | 3,000–8,000 | 12,000 |
| BOD₅ | mg/L | 1,500–3,500 | 5,500 |
| BOD/COD ratio | — | 0.35–0.50 | 0.30 |
| TSS | mg/L | 1,500–4,000 | 6,000 |
| VSS | mg/L | 1,200–3,200 | 5,000 |
| Sulfide (S²⁻) | mg/L | 20–100 | 200 |
| Total nitrogen | mg/L | 80–250 | 400 |
| Ammonia (NH₃-N) | mg/L | 50–150 | 250 |
| Oil & grease | mg/L | 200–800 | 1,500 |
| Temperature | °C | 25–38 | 45 |
The BOD/COD ratio of 0.35–0.50 confirms the wastewater is biodegradable, but only after upstream removal of sulfide and pH correction. Without those two steps, real removal efficiency drops to 40–55% regardless of aeration tank size.
The Four-Stage Treatment Train: From Screening to Reuse-Quality Effluent
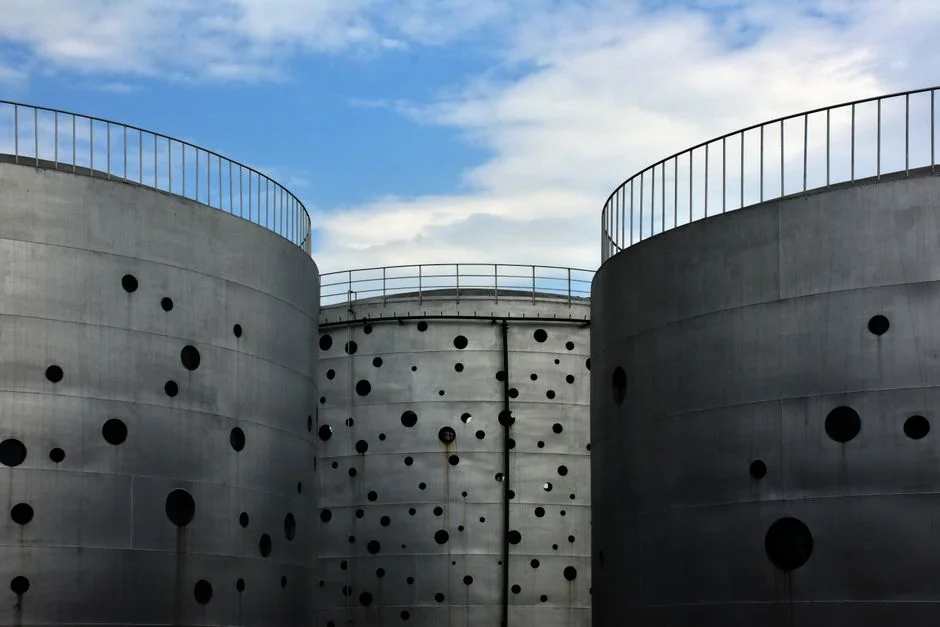
A rubber processing wastewater treatment system is a four-stage engineered train in which each stage is gated by a measurable performance target from the previous one. Skipping a stage breaks the train.
Stage 1 — Preliminary. A rotary bar screen for headworks at 3–6 mm aperture removes fiber, latex coagulum, and rubber scrap before they blind downstream equipment. Grit chambers follow, then an equalization basin sized for 6–12 h HRT to damp the 2.0–3.0× peak-to-average flow swings that characterize batch washing operations.
Stage 2 — Physicochemical. pH correction with caustic to 8.0–9.0 drives sulfide precipitation and converts dissolved sulfide to removable H₂S under stripping air. FeCl₃ or PAC coagulation at 100–300 mg/L then destabilizes colloids, and a DAF system for oil and TSS removal floats out oil, grease, and coagulated solids. This stage typically achieves 50–70% COD reduction and 80–90% TSS removal before biology sees the feed. For rubber-additives wastewater high in refractory organics and color, iron–carbon micro-electrolysis pretreatment at pH 2–3 has been reported to lift COD removal in the downstream train by 15–20 percentage points (per the 2020 rubber additives micro-electrolysis study).
Stage 3 — Biological. A two-stage high-rate configuration is the engineering default. A UASB reactor (or anaerobic lagoon for flow above 1,000 m³/day) handles 70–85% of COD conversion at low energy, followed by an aerobic stage — SBR, MBBR, or a MBR membrane bioreactor — for the residual COD and ammonia. Published work on two-stage UASB + down-flow hanging sponge (DHS) systems treating natural rubber effluent reports 92–96% overall COD removal at OLR 3–5 kg COD/m³·d (Tanikawa et al.). MBR is the choice when footprint or discharge TSS drives the decision.
Stage 4 — Tertiary. Multi-media filtration, activated carbon, or RO polishing delivers reuse-quality water. RO permeate runs TDS < 50 mg/L and COD < 30 mg/L, suitable for cooling tower make-up and process wash. Where discharge TDS limits are tight, an RO stage also reduces the brine volume sent to the evaporator or crystallizer in a ZLD configuration.
Choosing the Right Unit Operation: A Selection Matrix
Convert the generic three-stage diagrams in most supplier proposals into an engineering decision by applying the following if-then rules before equipment selection.
- Sulfide > 50 mg/L → mandate stripping or FeCl₃ precipitation before any biological stage.
- Oil/grease > 300 mg/L → mandate DAF as a primary stage, not as a polishing step.
- COD > 6,000 mg/L or flow > 500 m³/day → high-rate anaerobic (UASB/IC) before aerobic to control aeration energy.
- Footprint constrained → MBR over conventional activated sludge (60% smaller footprint, per MBR product spec).
- Reuse required → add RO after biological stage, sized for 60–75% recovery.
| Unit Operation | Footprint (rel.) | Energy Use (kWh/m³) | COD Removal | Indicative CAPEX (USD/m³·d) |
|---|---|---|---|---|
| UASB | Low | 0.05–0.15 | 70–85% | 150–300 |
| SBR | Medium | 0.40–0.70 | 85–92% | 350–550 |
| MBR | Low | 0.60–0.90 | 92–97% | 600–900 |
| MBBR | Medium | 0.50–0.80 | 88–94% | 450–700 |
The comparison clarifies why MBR is the default on flow < 500 m³/day with tight effluent TSS targets, and why UASB + SBR remains the workhorse at larger flows where aeration energy is the dominant OPEX line. Aeration alone typically accounts for 35–45% of total electricity use, so optimizing that stage has the largest OPEX payoff — see the 2026 aeration energy cost optimization reference for blower and DO control strategies.
Chemical Dosing and Sludge Handling for Rubber Plant Effluent
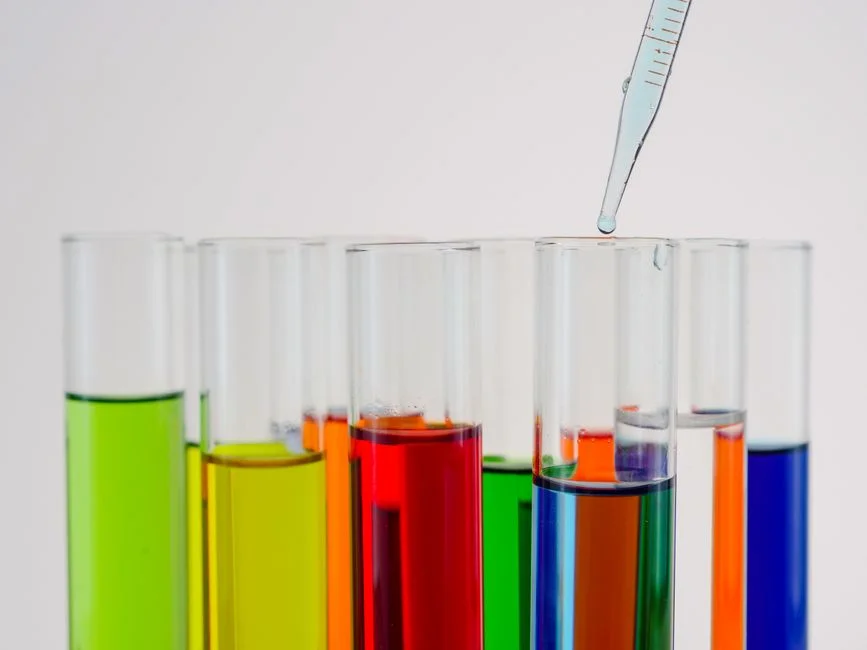
Two support systems decide whether the main train performs: chemical dosing and sludge handling. Both are typically undersized in junior-engineer designs.
The dosing program for the physicochemical stage runs on an automatic chemical dosing system with four reagent streams: NaOH (or lime) for pH correction to 8.0–9.0, FeCl₃ at 100–300 mg/L for coagulation, anionic polyacrylamide at 2–5 mg/L for flocculation, and silicone-based defoamer at 5–10 mg/L for latex-rich streams that tend to carry stable foam into the DAF cell.
Sludge production follows two distinct routes. Chemical sludge from the physicochemical stage yields 0.15–0.35 kg DS per kg COD removed. Biological waste activated sludge from the aerobic stage yields 0.10–0.20 kg DS per kg BOD removed. A combined 200 m³/day plant produces 350–600 kg DS/day, which is dewatered on a plate and frame filter press to 22–28% dry solids cake suitable for landfill or co-incineration. Filter press cloth life on rubber sludge runs 600–900 cycles before replacement; for lifecycle cost detail, see the 2026 filter press cloth replacement cost reference. Where UASB is installed, biogas yield runs 0.25–0.40 m³/kg COD removed — enough to offset 30–60% of plant thermal demand when a CHP unit is added. A 2026 UASB operating cost analysis places payback for the gas collection upgrade at 2–4 years for a 200 m³/day plant.
2026 Compliance Targets, Reuse Economics, and Cost Benchmarks
Procurement and EHS both need a closed-loop number set to defend the project internally. The 2026 regulatory envelope and economics for a rubber processing wastewater treatment system are summarized below.
| Item | 2026 Benchmark |
|---|---|
| Discharge COD | < 100–150 mg/L |
| Discharge BOD₅ | < 30 mg/L |
| Discharge TSS | < 30–50 mg/L |
| Discharge sulfide | < 1 mg/L |
| Oil & grease | < 10 mg/L |
| pH | 6–9 |
| RO permeate TDS | < 50 mg/L |
| RO permeate COD | < 30 mg/L |
| CAPEX (200 m³/day, four-stage) | USD 380,000–720,000 (excl. civil & ZLD crystallizer) |
| OPEX | USD 0.55–1.10 per m³ treated |
| Aeration share of OPEX | 35–45% |
| Sludge disposal share of OPEX | 20–30% |
The industrial RO system is sized for 60–75% recovery when reuse is the target, and is preceded by an industrial multi-media filter to protect the membranes from TSS breakthrough. The ZLD trigger is straightforward: when discharge fees exceed USD 0.40/m³ or fresh water cost exceeds USD 0.30/m³, RO plus a mechanical vapor recompression evaporator becomes the economic choice over end-of-pipe discharge. For TSS-limited sites, the 2026 suspended solids removal guide covers the back-end protection of the RO train.
Frequently Asked Questions
Should DAF be placed before or after the biological stage in a rubber wastewater train? Place DAF as a primary stage immediately after equalization whenever oil/grease exceeds 300 mg/L. Post-biology DAF only polishes residual solids and cannot recover the aeration energy wasted on emulsified oils upstream.
Is UASB required, or can an aerobic-only system handle rubber effluent? For COD > 6,000 mg/L or flow > 500 m³/day, high-rate anaerobic is required to keep aeration energy under 0.6 kWh/m³. Below those thresholds, an aerobic-only SBR or MBR train is technically feasible but runs 30–50% higher OPEX.
When does MBR beat conventional activated sludge? MBR is the right call when effluent TSS must stay below 10 mg/L for RO protection, when footprint is limited, or when the plant must handle hydraulic peaks above 2.5× average flow without losing biomass.
What reuse ratio is realistic for a rubber plant? With RO polishing after biological treatment, 60–75% of the treated flow can be reused as cooling tower make-up or process wash water, with the remaining 25–40% sent to discharge or to the brine evaporator in a ZLD configuration.
How is the chemical sludge handled, and what is the typical dewatering result? Chemical and biological sludge are combined, thickened to 2–4% DS, then dewatered on a plate and frame filter press to 22–28% DS cake. For a 200 m³/day plant, expect 350–600 kg DS/day of combined sludge before dewatering.