Where Aeration Energy Actually Goes in a Wastewater Plant
Aeration typically consumes 45–75% of a wastewater treatment plant's total energy, and in many municipal and industrial plants that share reaches 60% (Endress+Hauser, 2024). The number is not a marketing line — it is the structural reason the aeration blower is the first asset any plant engineer should attack in a 2026 OPEX review. Once the kWh split is understood, every downstream control decision — DO setpoint, VFD, diffuser, intermittent cycling — becomes a fix, not a debate.
The thermodynamic reality is worse than the headline figure. A blower motor drawing 100 kW of electrical input typically loses about 95 kW as heat in compression and only delivers about 1.0–1.3 kg of dissolved oxygen per kWh under field conditions (HydropureWater field data, 2025-11). The clean-water standard of 4–6 kg O₂/kWh assumes perfect mixing, zero fouling, and 20 °C water — none of which exist at a real plant. That alpha-factor gap (typically 0.4–0.7 at municipal works) is where most of the unaccounted energy disappears.
Four loss buckets explain essentially all the waste:
- SOTE correction: field oxygen transfer efficiency is 40–70% of clean-water SOTE, depending on diffuser depth, membrane fouling, and MLSS concentration.
- Off-design blower operation: throttled fixed-speed blowers run at 70–85% of full-load efficiency while moving only 50–60% of design airflow.
- Excess DO venting: operators routinely hold 2.5–3.0 mg/L O₂ when 1.8–2.0 mg/L is process-sufficient; every extra 0.5 mg/L is roughly 8–12% wasted airflow.
- Air handling: leaks, pressure drops in aged laterals, and fouled filters waste another 5–15% before the air reaches the basin.
The cost context matters. In a typical MBBR industrial plant, total OPEX runs $0.06–$0.18/m³ treated (HydropureWater 2026 MBBR operating cost article), of which 50–70% is the blower line item. Cutting aeration 30% does not just trim 30% off a single line — it cuts 15–20% off the entire plant OPEX, which is the size of payback that gets a CAPEX budget approved.
Tuning Dissolved Oxygen Setpoints by Treatment Zone
DO setpoint tuning is the highest-ROI, zero-CAPEX lever in the entire aeration playbook. Standard operating windows in 2026 practice are well established: 1.5–2.0 mg/L for carbonaceous BOD removal, 2.0–2.5 mg/L for full nitrification targeting NH₃-N below 1 mg/L in the effluent, and 0.2–0.5 mg/L in anoxic zones where denitrification needs nitrate but not oxygen (HydropureWater field data, 2025-08). Running aeration basins at the legacy default of 2.5–3.0 mg/L — common in plants commissioned before 2010 — wastes 15–25% of blower energy for no measurable effluent improvement.
Ammonia-based aeration control (ABAC) extends the basic DO loop by adding an online NH₃-N probe. When influent ammonia drops overnight or on weekends, the controller lowers the DO setpoint toward 0.5–1.0 mg/L instead of holding a fixed 2.0 mg/L. Endress+Hauser reports up to 30% aeration energy savings as the upper bound for ABAC on variable-load plants, with 12–20% being more typical at installations with stable diurnal flow.
Zoning is what makes the control band mechanically achievable. The WSZ series A/O packaged treatment plant with separated anoxic and aerobic zones uses a physical baffle wall that lets operators tune DO in each chamber independently, rather than chasing a single basin-wide average. This is the structural prerequisite for any meaningful setpoint strategy.
| Zone | Process Goal | 2026 DO Setpoint (mg/L) | Effect of 0.5 mg/L Excess |
|---|---|---|---|
| Anoxic | Denitrification (NO₃ → N₂) | 0.2–0.5 | Disrupts DNF, raises effluent NO₃ |
| Aerobic – carbonaceous | BOD removal | 1.5–2.0 | ~8–12% wasted airflow per 0.5 mg/L |
| Aerobic – nitrification | NH₃-N → NO₃ | 2.0–2.5 | ~10–15% wasted airflow per 0.5 mg/L |
| Aerobic – MBR scouring air | Membrane cleaning | Not DO-controlled | Fixed by membrane supplier spec |
Blower Selection, VFD Retrofit, and Off-Design Savings
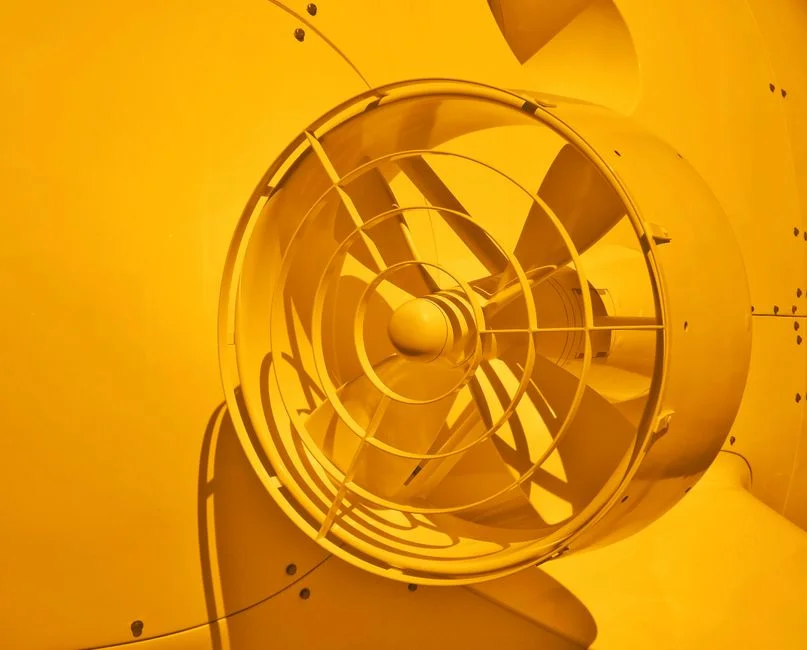
Most blowers at plants built before 2020 run fixed-speed and throttled. That is the worst possible operating point for the affinity laws: at 60% airflow, a fixed-speed lobe blower still draws roughly 85% of full-load power because the throttling valve discards the excess as heat. A VFD-controlled high-speed turbo blower at the same 60% airflow draws only 35–45% of full-load power, a 40–50 percentage-point swing on the electricity bill. Across a year, this is 25–40% blower energy reduction on any plant with diurnal load swings of more than 20%.
The blower-type selection matters as much as the VFD. Lobe positive-displacement units are mechanically simple but hold only 70–75% isentropic efficiency at full load and degrade sharply under turndown. Multistage centrifugal blowers reach 75–80% efficiency with good 60–100% turndown but struggle below 50% load. High-speed turbo blowers with integral VFDs and magnetic bearings hit 80–82% isentropic efficiency at 50–100% load and are the 2026 default for new aeration installations above 50 kW.
A useful 2026 OPEX anchor: 1 m³/min of compressed air at 0.5 bar (g) costs roughly $0.40–$0.80/hour in electricity at $0.10/kWh (HydropureWater field data, 2025-09). Every 10% airflow cut at the basin returns a directly measurable line item. VFD retrofits do carry a maintenance tradeoff — they add harmonic filter requirements, bearing-monitoring sensors, and inverter cooling — and operators should pair the upgrade with predictive maintenance for aeration blowers and diffusers to protect the additional rotating equipment.
| Blower Type | Full-Load Isentropic Efficiency | Turndown Range | 60% Airflow Power Draw (vs full load) | 2026 Typical Use Case |
|---|---|---|---|---|
| Lobe PD (fixed-speed) | 70–75% | Poor (50–100%) | ~85% | Legacy small plants, intermittent duty |
| Multistage centrifugal | 75–80% | Good (60–100%) | ~70% | Municipal works 50–500 kW |
| High-speed turbo + VFD | 80–82% | Excellent (40–100%) | ~35–45% | New 2026 builds, variable load |
| Screw compressor (PD + VFD) | 72–78% | Good (50–100%) | ~55–60% | Industrial oily/emulsified waste |
Diffuser Technology and Standard Oxygen Transfer Efficiency
Diffuser selection locks in long-term OPEX. The SOTE benchmark ranges that should drive any 2026 replacement decision are: coarse-bubble 12–18%, fine-bubble disc or membrane 25–40%, tube diffuser 20–30%, and jet aerator 15–25% (SSI Aeration, 2025). Fine-bubble disc and membrane diffusers typically cut required airflow 30–45% versus coarse-bubble at the same oxygen demand, with payback of 12–30 months at industrial electricity rates.
Within fine-bubble, the practical choice is EPDM or silicone membrane versus ceramic. EPDM and silicone membranes tolerate biological fouling better, are field-cleanable with in-situ acid washing, and cost less per unit. Ceramic discs last longer (often 15+ years versus 8–10 for membrane) but replacement cost is 2–3× higher and they are more sensitive to thermal shock. For most 2026 retrofits, the answer is membrane fine-bubble unless the basin temperature regularly exceeds 35 °C or the influent carries abrasive grit.
MBR plants have a special case. The DF series PVDF flat sheet MBR modules with integrated aeration scouring rely on coarse-bubble air directly under the membrane stack to keep the 0.1 μm PVDF surface clean — that scouring air cannot be turned off during operation, no matter what the biological DO demand is. Process air and scouring air should be on separate blowers and separate controls; the integrated MBR packaged treatment system is sized so scouring air typically runs at 30–60% of total MBR airflow but at a deliberately low SOTE (it is buying shear, not oxygen).
Process-Level Savings: Intermittent, Sidestream, and MBBR/MBR Strategies

Process design choices can cut another 10–30% of aeration energy on top of hardware upgrades, and they are often free. Intermittent aeration — for example, 30 minutes on / 15 minutes off cycling in extended aeration basins — exploits simultaneous nitrification-denitrification (SND) inside the floc. Aerobic periods handle the BOD and ammonia; the anoxic periods that follow let the same biomass denitrify. Operators routinely see 20–30% blower energy reduction at compliance-equivalent effluent quality.
Sidestream loads are an underestimated driver. Returning centrifuge centrate, gravity thickener supernatant, or filter backwash at high NH₃-N concentrations (often 500–1,500 mg/L) into the head of the aeration basin forces the main-stream DO controller to oversize for shock events. The 2026 fix is either a dedicated sidestream deammonification reactor (partial nitritation/Anammox) that cuts sidestream NH₃ load by 80–90%, or an equalization basin with controlled return rate. Either approach typically cuts main-stream aeration demand 10–20%.
MBBR and MBR systems need different strategies. In moving-bed reactors, aeration serves both biology and carrier mixing, but because biomass is attached to the media, the basin can run at the low end of the DO band — 1.8–2.0 mg/L is feasible without losing nitrification rates. This is one of the structural reasons MBBR OPEX runs $0.06–$0.18/m³ (HydropureWater 2026 MBBR operating cost guide). In MBR plants, the rule is non-negotiable: process air and scouring air are separate systems, and scouring air cannot be turned off. The MBBR OPEX 2026 benchmarks from the HydropureWater operating cost guide are the right reference when comparing moving-bed against activated-sludge retrofits.
Calculating Real Savings: A Worked 2026 Example
The numbers are easier to defend than the theory. Take a 5,000 m³/d industrial WWTP with a 220 kW blower running 24/7 at $0.10/kWh. Baseline aeration OPEX is 220 kW × 24 h × $0.10/kWh = $528/day, or $192,720/year — equivalent to $0.106/m³ on the treated volume.
Now stack the three optimization levers:
- DO setpoint tuning + ABAC: 15% reduction → 187 kW equivalent
- VFD retrofit on existing blower: additional 20% reduction on the load already lowered → 150 kW equivalent
- Fine-bubble diffuser replacement: further 25% reduction → 112 kW equivalent
Stacked, the plant moves from 220 kW to roughly 110 kW, a 50% blower OPEX cut. New daily cost: $264/day, $96,360/year, or about $0.053/m³. Net annual savings: $96,360.
2026 CAPEX for the bundle on a 5,000 m³/d plant: DO/ammonia probe skid $25,000–$60,000, VFD skid $40,000–$120,000, fine-bubble diffuser retrofit $80,000–$250,000. Total $145,000–$430,000. Payback at the midpoint ($290K CAPEX, $96K/year savings) is 3.0 years; payback on the conservative end ($430K CAPEX) is 4.5 years — both well within standard 7–10 year asset life. The same control upgrades also stabilize effluent NH₃-N, which avoids 91/271/EEC or local EPA excursion penalties that can run $10,000–$100,000 per incident.
| Line Item | Baseline | Post-Optimization | Change |
|---|---|---|---|
| Blower power draw | 220 kW | ~110 kW | -50% |
| Daily aeration OPEX (@$0.10/kWh) | $528 | $264 | -$264/day |
| Annual aeration OPEX | $192,720 | $96,360 | -$96,360/year |
| OPEX per m³ treated | $0.106 | $0.053 | -50% |
| Bundle CAPEX (typical) | — | $145K–$430K | 1.5–4.5 yr payback |
90-Day Action List to Hand to Procurement
A defensible aeration retrofit does not start with a purchase order; it starts with measurement. The following phased plan turns the article's theory into a board-ready business case in one quarter.
- Days 1–15 — Audit. Pull 30 days of blower kWh, DO trend, and influent flow data. Identify the four loss buckets: alpha-factor gap, off-design blower operation, excess DO, and air handling. Estimate current $/m³.
- Days 16–30 — Quick wins. Lower aerobic DO setpoints to 1.8–2.0 mg/L (carbonaceous) and 2.0–2.5 mg/L (nitrification). Verify effluent quality holds. Expected 8–15% blower OPEX reduction at zero CAPEX.
- Days 31–60 — Sensing upgrade. Install online NH₃-N and NO₃-N probes. Enable ABAC logic. Add DO control loops in each aerobic zone. Use AI process control for sewage treatment in 2026 if budget allows, with manual tuning as fallback.
- Days 61–75 — Capital scope. Issue RFP for VFD skid and fine-bubble diffuser retrofit. Request guaranteed SOTE, harmonic compliance, and bearing-monitoring sensors on blower.
- Days 76–90 — Business case. Compile the worked example into a finance-ready memo: baseline OPEX, projected OPEX, CAPEX, payback, and avoided penalty value. Submit to procurement.
The two-week audit alone usually pays for the rest of the program, because most plants discover they are running 30–50% more airflow than the biology actually needs.
Frequently Asked Questions
What is the single biggest energy saver in wastewater aeration?
DO setpoint tuning combined with VFD blower control. Together they typically cut aeration OPEX 25–40% with 1.5–3 year payback, before any diffuser replacement. Diffuser upgrades are the third lever and add another 20–30% on top, but require CAPEX and a basin drain.
How much more efficient is fine-bubble versus coarse-bubble diffuser?
Fine-bubble disc or membrane diffusers deliver 25–40% standard oxygen transfer efficiency (SOTE) versus 12–18% for coarse-bubble. At equal oxygen demand this means 30–45% less airflow, and therefore 30–45% less blower energy. Membrane fine-bubble is the 2026 default for biological aeration.
Can MBR scouring air be turned off to save energy?
No. Scouring air beneath the membrane stack is required to keep the 0.1 μm PVDF or PES surface clean and prevent fouling. Typical MBR scouring air demand is 0.1–0.3 m³/m²·h, and it should be on a separate blower from process air so the two control loops do not fight each other.
What savings does a VFD give versus a fixed-speed blower?
At 60% airflow, a fixed-speed blower still draws about 85% of full-load power (affinity law), while a VFD-controlled blower draws 35–45%. Across a year on a variable-load plant this is 25–40% blower energy reduction, with typical VFD skid payback of 2–4 years at industrial electricity rates.
What is the typical payback for a full aeration optimization package?
A combined DO-tuning, VFD, and fine-bubble diffuser upgrade on a 5,000 m³/d industrial plant costs $145,000–$430,000 in 2026 and saves $80,000–$120,000/year in electricity. Payback lands between 1.5 and 4.5 years, well inside the 7–10 year asset life of new diffusers and blowers.
Related Equipment
- HydropureWater automatic chemical dosing systems — specifications, capacity range, and technical data