What Makes Fine Chemical Wastewater Different in 2026
Fine chemical wastewater — produced during synthesis of pharmaceutical intermediates, dyes, pesticides, and specialty organics — carries a pollutant fingerprint that generic municipal recipes cannot touch. In 2026, influent streams typically run COD 5,000–60,000 mg/L, BOD/COD ratios below 0.25 (often 0.10–0.20 for nitroaromatics and sulfa-drug intermediates), total nitrogen 200–3,000 mg/L, salinity 5,000–50,000 mg/L Cl⁻, color 500–5,000 Pt-Co, residual heavy metals (Ni, Cu, Cr, Pd catalyst traces), and pH swings of 1–13 between batches. The biorefractory fraction — heterocycles, halogenated aromatics, nitro-compounds — is what separates this stream from commodity chemicals and from pharma API mother liquor; the latter is usually segregated for incineration rather than biological treatment.
Three regulatory anchors frame any 2026 design. China GB 21523-2008 (with the 2024 amendment package currently in provincial rollout) caps COD at 100 mg/L, NH3-N at 15 mg/L, TN at 35 mg/L, color at 50 dilution-multiples. The EU Industrial Emissions Directive 2010/75/EU sets BAT-AEL ranges of COD 30–200 mg/L, TOC 10–60 mg/L, and AOX 0.5–5 mg/L for common waste water from chemical installations. India CPCB Schedule I and US EPA 40 CFR Part 414 (organic chemicals, plastics, synthetic fibers) round out the compliance landscape for export-oriented Indian and US Gulf Coast plants.
The consequence is structural: BOD/COD below 0.25 means biology alone cannot meet discharge limits, so a physico-chemical AOP stage must run upstream. Salinity above roughly 8,000 mg/L Cl⁻ begins to osmotically stress conventional activated sludge, so either halotolerant biomass acclimation or a sidestream RO/evaporation route is mandatory. The four-stage train that follows — source segregation, physico-chemical AOP, biology, membrane/evaporation polish — is the direct engineering response to those two constraints.
| Parameter | Typical 2026 Influent | GB 21523-2008 Limit | BAT-AEL Range (EU) |
|---|---|---|---|
| COD | 5,000–60,000 mg/L | ≤100 mg/L | 30–200 mg/L |
| BOD/COD | 0.10–0.25 | — | — |
| TN | 200–3,000 mg/L | ≤35 mg/L | 10–40 mg/L |
| NH3-N | 50–800 mg/L | ≤15 mg/L | 1–10 mg/L |
| Salinity (Cl⁻) | 5,000–50,000 mg/L | — | — |
| Color | 500–5,000 Pt-Co | ≤50 dil. | — |
| pH | 1–13 (batch swings) | 6–9 | — |
Source Control and Equalization: The First 30% of Performance
Source segregation and equalization routinely deliver more operating margin than the next reactor on the spec sheet. Segregate by stream family before any pipe enters a common header: high-COD mother liquor (often 80,000–150,000 mg/L COD), low-COD wash water (200–1,500 mg/L), high-salinity brine from crystallization, and rinse streams. Co-mixing these without a mass-balance model almost guarantees either an overloaded AOP stage or a starved biological one, because a single batch dump of mother liquor can swing the equalized feed COD by 40–60% within an hour.
Equalization tank sizing for fine chemical batch plants runs 8–24 hours HRT, sized to the longest production campaign plus two cleaning cycles, with mechanical mixers sized at 4–8 W/m³, pH/temperature/ORP probes feeding the SCADA, and gentle aeration (0.5–1.0 m³ air/m³·h) to prevent septicity in the low-COD wash fraction. pH equalization to 6.5–8.5 before the biological stage is best handled by an automatic chemical dosing system with NaOH/HCl dose ranges of 0.5–3.0 L per m³ of flow, deadband ±0.3 pH units, and redundant metering pumps. Temperature control matters as much as dosing: Fenton performs best at 25–35 °C, so equalization is also where cooling tower return or waste heat gets routed to bring the feed to setpoint before AOP.
Physico-Chemical Pretreatment: Coagulation, Fenton, and Ozone AOP
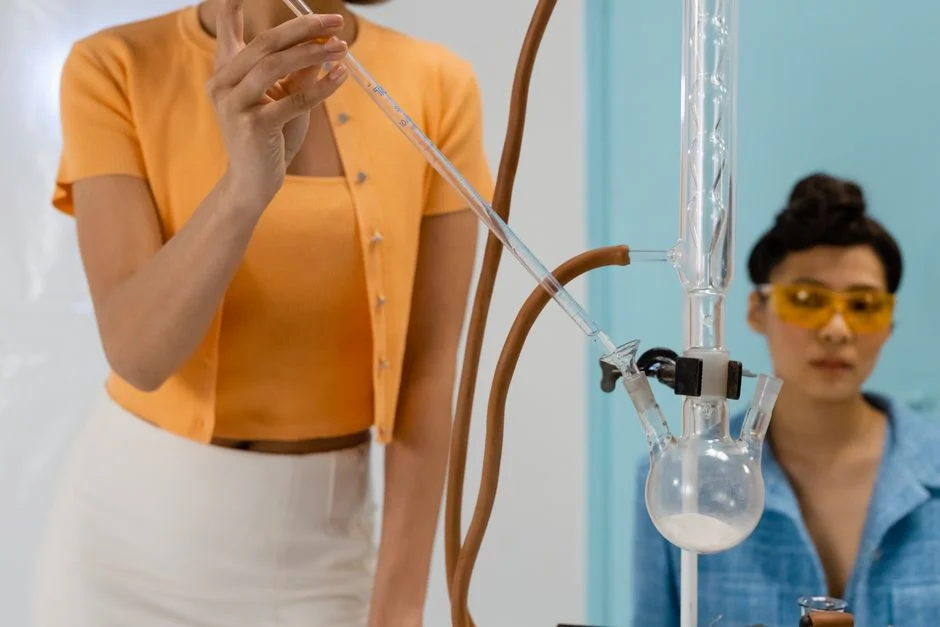
The physico-chemical stage is where biorefractory load gets converted into something biology can finish. Start with coagulation: polyaluminum chloride (PAC) at 100–300 mg/L plus anionic PAM at 1–5 mg/L typically removes 50–80% of suspended solids and 20–35% of colloidal COD before any oxidation step — without that, Fenton reagents burn on particulates instead of dissolved organics.
Fenton oxidation is the workhorse for most fine chemical sites in 2026. Operate at pH 3.0–3.5 with the H2O2:Fe2+ molar ratio held at 5–10:1, H2O2 dose 0.5–5.0 g per g COD, and reaction time 30–90 minutes; expect 40–75% COD removal on the biorefractory fraction. Re-neutralize to pH 7–8 with lime (Ca(OH)₂) — the resulting iron-rich sludge is the main OPEX penalty, typically 0.3–0.8 kg dry solids per m³ treated. Where the site has a tight water footprint and iron in the clarifier overflow will trip downstream RO, ozone-based AOP is the alternative: 1–3 g O₃ per g COD delivers 50–85% COD removal and decolorizes more than 90% of dye-bearing streams, with no metallic sludge but higher CAPEX and a 0.8–1.2 kWh/m³ energy draw for ozone generation.
Wet air oxidation (WAO) handles the 5–15% of streams too toxic for Fenton — high-N heterocyclic mother liquor, cyanopyridine derivatives, certain pesticide intermediates. WAO runs at 200–320 °C and 5–15 MPa to deliver 60–95% COD removal, but CAPEX lands at 3–5× Fenton per m³·d, so it is reserved for the worst feeds. After any AOP route, route the liquor to a DAF system for Fenton sludge and floated FOG removal; surface loading 5–20 m³/m²·h is the design band, and the available skid range covers 4–300 m³/h across 13 standard models. Decision rule: Fenton first if iron sludge is acceptable and OPEX is the constraint; ozone AOP first if downstream RO is sensitive to iron or the site has an on-site oxygen supply.
| AOP Option | Dose / Condition | COD Removal | Sludge / Byproduct | CAPEX Index |
|---|---|---|---|---|
| Fenton | 0.5–5.0 g H2O2/g COD, pH 3–3.5, 30–90 min | 40–75% | Iron-rich, 0.3–0.8 kg DS/m³ | 1.0× |
| Ozone AOP | 1–3 g O₃/g COD, pH 7–9 | 50–85% | None (gas) | 2.5–3.0× |
| WAO | 200–320 °C, 5–15 MPa | 60–95% | Mineral residue | 3.0–5.0× |
| PAC + PAM coagulation | PAC 100–300 mg/L, PAM 1–5 mg/L | 20–35% (colloidal) | Chemical sludge | 0.3× |
Biological Treatment: MBR vs SBR vs A/O for the Biodegradable Load
Once AOP has cracked the biorefractory fraction, the residual biodegradable load is small enough for biology to finish. Conventional activated sludge begins losing performance above 8,000 mg/L Cl⁻, so for saline fine chemical streams acclimate halotolerant biomass gradually (0.5–1.0 g NaCl/L per day ramp) or move directly to MBR with a sidestream RO that drops the salinity to biology-friendly levels before the aeration tank.
The reactor choice maps to influent character. A/O (anoxic-oxic) handles TN 200–1,000 mg/L streams with HRT 24–48 h, MLSS 3,000–5,000 mg/L, internal recycle 200–400%, and TN removal of 70–90%. SBR fits batch fine chemical discharges where flows are intermittent: fill/react/settle/decant cycle of 8–24 h, MLSS 4,000–6,000 mg/L, F/M 0.05–0.20 kg BOD/kg MLSS·d. MBR is the tightest option for sites with constrained footprint or strict effluent SS limits: submerged PVDF hollow-fiber membranes at 0.1 µm, MLSS 6,000–12,000 mg/L, flux 10–25 L/m²·h, effluent SS below 5 mg/L and COD 50–200 mg/L depending on the upstream AOP cut. Upstream of any MBR, install a rotary mechanical bar screen with 2–6 mm aperture to protect membranes from rags, fibrous debris, and packaging fragments that survive equalization.
| Reactor | HRT | MLSS (mg/L) | Salinity Limit (Cl⁻) | TN Removal | Best For |
|---|---|---|---|---|---|
| A/O | 24–48 h | 3,000–5,000 | ≤8,000 mg/L | 70–90% | Continuous flow, mid-TN |
| SBR | 8–24 h/cycle | 4,000–6,000 | ≤10,000 mg/L | 60–80% | Batch discharges |
| MBR | 12–36 h | 6,000–12,000 | ≤12,000 mg/L | 70–85% | Tight SS, small footprint |
Advanced Polishing: RO, Ion Exchange, and ZLD Evaporation
Polishing closes the loop on water reuse or pushes the plant to zero-liquid-discharge where local regulations or aquifer concerns make discharge non-feasible. Industrial RO polishing in a two-stage configuration runs at 65–85% recovery with permeate conductivity below 50 µS/cm, suitable for cooling-tower make-up, scrubber loop, or once-through boiler feed after a downstream mixed-bed polisher. In front of the RO, a multi-media filter (sand + anthracite + garnet layers, automated backwash at 8–12 m/h) is non-negotiable — SDI below 3 protects the RO membranes and is the difference between a 3-year membrane life and a 6-month one. An industrial RO system sized at 75–85% recovery is the standard polish for fine chemical sites in 2026.
Brine management is where projects fail commercially. RO concentrate is 15–25% of feed volume at 5,000–80,000 mg/L TDS, and pushing it through a mechanical vapor recompression (MVR) or thermal vapor recompression (TVR) evaporator is the standard route to true ZLD, with crystallizer residue of 0.5–2.0% of feed volume hauled off as solid waste. Ion exchange is selective — use it for residual heavy metals (Ni²⁺, Cu²⁺, Cr³⁺ below 5 mg/L each) when plating rinse co-mingles with fine chemical mother liquor and the metals would foul downstream RO. For sites with land and a brine pond option, multi-stage solar evaporation at 3.51 kg·m⁻²·h⁻¹ (1-sun reference) as reported in a 2025 Device paper can serve as a non-grid fallback for brine volume reduction, but treat it as a tertiary add-on, not the primary treatment — energy density is 10–30× lower than MVR.
2026 Cost Benchmark and Decision Matrix
CAPEX for a complete fine chemical wastewater treatment train in 2026 sits in the $400–$1,800 per m³·d of design capacity band, dominated by stainless-steel vessels (316L for Cl⁻ above 10,000 mg/L), membrane skids, and AOP reactors. Trains anchored on Fenton + A/O + MBR + RO land at the low-to-mid range ($500–$900/m³·d); ozone AOP upgrades push that to $800–$1,300/m³·d; WAO + MBR + evaporation ZLD sits at $1,200–$1,800/m³·d because of the high-pressure reactors and crystallizer package. OPEX runs $0.25–$1.10 per m³ treated, broken down as chemical cost 25–40%, energy 30–45%, sludge handling 10–20%, labor 10–20%. The single largest OPEX lever is chemical spend, and the wastewater treatment chemical cost optimization guide documents how coagulant and H2O₂ optimization alone can shave 15–25% off that line item.
| Process Train | Influent COD Fit | Salinity Tolerance | Effluent vs GB 21523 | Footprint | CAPEX Index | OPEX Index | Complexity |
|---|---|---|---|---|---|---|---|
| Fenton + A/O + MBR + RO | 5,000–30,000 mg/L | ≤8,000 mg/L Cl⁻ | Meets | Medium | 1.0× | 1.0× | Low–Medium |
| Ozone + SBR + MBR + RO | 5,000–40,000 mg/L | ≤10,000 mg/L Cl⁻ | Meets | Medium–Large | 1.6× | 1.2× | Medium |
| WAO + MBR + Evaporation ZLD | 10,000–60,000 mg/L | ≤50,000 mg/L Cl⁻ | Exceeds (ZLD) | Large | 2.5–3.0× | 1.6–2.0× | High |
Frequently Asked Questions
What is the typical BOD/COD ratio for fine chemical wastewater, and why does it matter?
Most fine chemical streams in 2026 run BOD/COD of 0.10–0.25 (HydropureWater field data, 2026). Below 0.25, conventional activated sludge alone cannot reach GB 21523-2008 COD ≤100 mg/L, so a physico-chemical AOP stage is mandatory upstream of biology. The lower the ratio, the larger the AOP reactor and the higher the H2O₂ dose per gram of COD removed.
Can MBR handle saline fine chemical streams directly?
Yes, up to roughly 12,000 mg/L Cl⁻ with the MBR section above, using halotolerant biomass acclimated at 0.5–1.0 g NaCl/L per day. Above that, sidestream RO must drop the salinity to biology-friendly levels before the aeration tank, or the train should pivot to WAO + evaporation ZLD.
How much does a complete Fenton + MBR + RO train cost per m³·d in 2026?
CAPEX lands at $500–$900 per m³·d, OPEX at $0.30–$0.60 per m³ treated. Adding ozone AOP raises CAPEX roughly 60% and OPEX 15–25% (per the cost benchmark section above).
Is zero-liquid-discharge (ZLD) mandatory for fine chemical plants in 2026?
Not universally, but increasingly so. China provincial rollout of the GB 21523-2008 amendment package is moving several chemical parks to ZLD; EU BAT-AEL permits discharge for many installations. India CPCB Schedule I and US EPA 40 CFR Part 414 are discharge-permit frameworks, not ZLD mandates, but aquifer-protection overlays in Gujarat, Texas, and Shandong frequently force ZLD anyway.
How do I know whether my existing plant is bottlenecked at AOP, biology, or the membrane stage?
Sample equalized feed, AOP effluent, MBR effluent, and RO permeate in the same shift. If AOP effluent COD is still above 800 mg/L, the AOP reactor is undersized or the H2O₂ dose is too low. If AOP effluent is below 500 mg/L but MBR effluent holds above 250 mg/L, the biology is salinity-shocked or MLSS has dropped below 4,000 mg/L. If MBR effluent is below 150 mg/L but RO flux has fallen 30%+ from nameplate, the multi-media filter upstream of RO is likely failing the SDI below 3 target and the membranes are fouling.
Related Equipment
- MBR membrane bioreactor — specifications, capacity range, and technical data