Why Copper Removal Method Choice Matters in 2026
Reported Cu(II) concentrations in industrial wastewater span approximately 2.5 mg/L to 10,000 mg/L — a roughly 4,000× range that no single technology covers efficiently, according to a 2023 review in the International Journal of Environmental Research and Public Health (Liu et al., 2023-02-22). The same review cites the 2026-relevant regulatory numbers buyers must hit: U.S. EPA 1.3 mg/L and WHO 3 mg/L for drinking water, China GB 3838-2002 ≤1.0 mg/L for surface water, and China GB 14848-2017 ≤1.5 mg/L for groundwater.
Cu(II) is a typical transition metal, acutely toxic to aquatic species in marine water at 4.8 g/L per a 2022 review in Water (MDPI, 2022), and is widely discharged by electroplating, metal finishing, mining, electronics, and printed-circuit-board operations (Liu et al., 2023-02-22). Field evidence of widespread contamination is documented in the same review: UK freshwater Cu(II) measured at 0.02–133 mg/L, and 39.1% of surface-water area in the western Netherlands with excess Cu(II). Selection in 2026 is therefore a coupled problem — influent concentration, target effluent, flow rate, sludge handling, and copper-recovery value all enter the decision (Al-Saydeh et al., Journal of Industrial and Engineering Chemistry, 2017).
The Six Copper Removal Method Families at a Glance
Liu et al. (2023-02-22) group Cu(II) treatment into physicochemical and biological families. The physicochemical side breaks into chemical precipitation, ion exchange, adsorption, membrane separation, and electrochemistry; the biological side covers biosorption, bioprecipitation, and biomineralization. The one-line trade-off for each family, drawn from the same review and the MDPI 2022 review, is:
| Family | One-line trade-off | Best at a glance |
|---|---|---|
| Chemical precipitation | Cheapest per kg Cu removed, but sludge-bound | High-strength, high-flow streams |
| Ion exchange | Sub-mg/L polish, but regeneration chemistry | Low-to-moderate Cu, polishing duty |
| Adsorption | Flexible, low-CAPEX, but spent media is waste | Sludge-constrained sites, low load |
| Membrane separation (UF/NF/RO) | Tight effluent, but pressure and concentrate handling | Sub-mg/L polish, water reuse |
| Electrochemistry | No chemicals, but electrodes and power | Cu-recovery, low-flow sites |
| Biosorption / biomineralization | Agricultural-waste feedstock, but pilot-stage | Sludge-constrained, low load |
Al-Saydeh et al. (2017) note that adsorption is the most commonly cited process for Cu(II) removal in the industrial-wastewater literature, and that physicochemical treatments in general are the most widely deployed for copper-bearing effluents. Use this table as a map before drilling into each family.
Chemical Precipitation: The Workhorse for High-Strength Streams
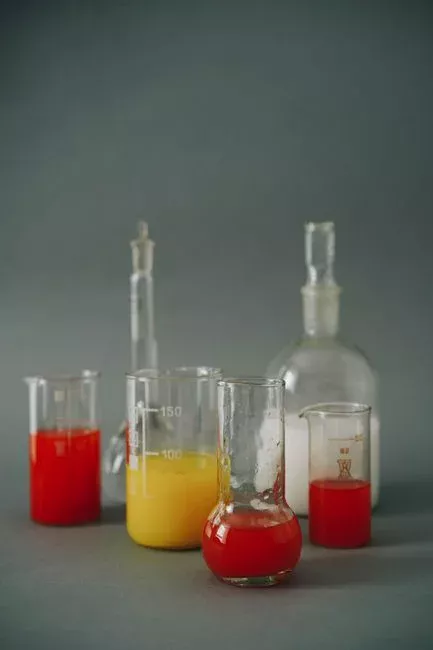
Chemical precipitation raises pH with NaOH, lime, or Na₂CO₃ to drop Cu(II) out as Cu(OH)₂ or basic copper carbonate; the resulting metal-bearing sludge is the dominant operating liability (Liu et al., 2023-02-22). It is the default first stage in the upper part of the 2.5–10,000 mg/L influent range, where the cost per kilogram of Cu removed is lowest, but the achievable effluent sits in the mid-mg/L band — additional polishing is required to meet the 1.3 mg/L U.S. EPA drinking-water benchmark or the ≤1.0 mg/L China GB 3838-2002 surface-water limit cited in the same review.
Operating window is alkaline — pH correction is needed before discharge or before any downstream RO element (Liu et al., 2023-02-22; Al-Saydeh et al., 2017). The same Box–Behnken response-surface approach that drove an azo-dye study to 96.14% decolorization with ferrous sulfate at pH 10 and 159.64 mg/L, 84.37% with aluminum sulfate at pH 8.26 and 80 mg/L, and 98.28% with polymeric iron sulfate at pH 6.35 and 141.66 mg/L (MDPI Sustainability, 2019) transfers directly to copper-hydroxide dose optimisation. By-product handling drives the rest of the train — sludge volume sets the downstream plate and frame filter press for copper-bearing sludge sizing (Al-Saydeh et al., 2017), and pH/clarity drive the choice of PLC-controlled chemical dosing systems for precipitation trains and a lamella clarifier for copper-hydroxide settling.
Ion Exchange: Sub-mg/L Polishing Without Membranes
Cu²⁺ exchanges onto a cationic (strong-acid or chelating) resin and is later eluted with acid for resin regeneration and Cu recovery, per Liu et al. (2023-02-22). The best fit is low-to-moderate Cu(II) influent where the goal is sub-mg/L or ppb effluent — for example polishing a precipitation overflow to meet the 1.3 mg/L U.S. EPA drinking-water benchmark cited in the same review. Strengths are high selectivity, simple operation, and a well-understood resin supply chain (Liu et al., 2023-02-22).
The weakness is that regeneration produces an acid- and Cu-rich eluent that must be neutralised or sent to downstream recovery, and competing ions (Ca²⁺, Mg²⁺, Na⁺) reduce effective capacity (Liu et al., 2023-02-22). For sites where the target approaches the 1.0 mg/L GB 3838-2002 surface-water limit or the 1.5 mg/L GB 14848-2017 groundwater limit, an EDI for ultrapure copper polishing without acid/caustic regeneration stack polishes RO permeate without producing a regeneration wastewater, and a properly sized industrial water softener up front protects resin capacity from hardness breakthrough.
Adsorption: Flexible, Low-Capex, Sludge-Free
Adsorption is the most commonly cited process for Cu(II) removal from industrial wastewater according to Al-Saydeh et al. (2017). Liu et al. (2023-02-22) report a ZnO-impregnated UF hybrid matrix that achieved 92% Cu(II) removal with 88 mg/g adsorption capacity at pH 8 and a specific flux of 0.115 L m⁻² h⁻¹ kPa⁻¹ — a useful sizing reference when calculating adsorbent mass for a polishing bed.
An emerging engineered-carbon option is copper-impregnated biochar, which has been studied for copper-cyanide complex removal, showing that engineered carbons can be tuned to tackle both free Cu²⁺ and Cu-CN species (SSRN, 2024). The best fit for adsorption is low-to-moderate Cu(II) streams, polishing duty, or sites where sludge disposal is the binding constraint (Al-Saydeh et al., 2017). The weakness is that spent adsorbent is a solid waste that requires thermal regeneration or send-out disposal, and the per-kilogram Cu cost is higher than precipitation at high loadings (MDPI Water, 2022).
Membrane Separation: UF, NF, RO and Electrodialysis
Membrane pore sizes cited in Liu et al. (2023-02-22) are MF 0.2–1 μm, UF 5–0.2 μm, NF 0.5–5 nm, and RO 0.2–0.3 nm. Microfiltration alone is rarely effective for ionic Cu because its 100–1000 nm pore size is not an absolute barrier to heavy metals, per the same review. UF alone can exceed 90% Cu removal at influent 10–160 mg/L, pH 5.5–6, and 2–5 bar operating pressure, according to the MDPI Water 2022 review — but only when paired with an adsorbing matrix. Polymer-enhanced UF (PEUF) with polyvinylamine as the chelating agent reached 97% Cu(II) removal and is a proven route to push UF performance into the sub-mg/L zone (Liu et al., 2023-02-22).
NF sits between UF and RO: lower working pressure than RO, better ion selectivity than UF (Liu et al., 2023-02-22). Under 3–5 bar and pH 1.50–5, NF completely recovered Cu ions from a 1000 mg/L feed, but rejection drops when feed rises to 2000 mg/L (MDPI Water, 2022). RO spans 70–99.9% Cu removal across the same review; energy is the binding OPEX, and unintended removal of non-target ions is a documented side effect (Liu et al., 2023-02-22). Electrodialysis moves Cu²⁺ through ion-exchange membranes under an electric field — useful when copper recovery, not just removal, is the goal (Liu et al., 2023-02-22; MDPI Water, 2022). All membrane trains must be preceded by multimedia filtration to control SDI; a multi-media filter for RO pretreatment on a copper train protects the elements, and a hydropure UF system for copper-laden wastewater polishing paired with industrial RO for sub-mg/L copper polishing covers the upper end of the polish train. Pore-size and operating-window data for each membrane family:
| Membrane | Pore size | Reported Cu window | Pressure | Role |
|---|---|---|---|---|
| MF | 100–1000 nm | Not effective alone for ionic Cu | Low | Solids removal upstream |
| UF (with hybrid matrix) | 5–0.2 μm | >90% at 10–160 mg/L, pH 5.5–6 | 2–5 bar | Polish with adsorption |
| PEUF (UF + polymer) | 5–0.2 μm | 97% with polyvinylamine | 2–5 bar | Sub-mg/L via polymer binding |
| NF | 0.5–5 nm | Complete at 1000 mg/L; drops at 2000 mg/L; pH 1.50–5 | 3–5 bar | Middle-ground pressure polish |
| RO | 0.2–0.3 nm | 70–99.9% removal | Higher | Final sub-mg/L polish |
| Electrodialysis | Ion-exchange membranes | Cu²⁺ migration under electric field | Electric field | Cu recovery, not just removal |
Electrochemical and Photocatalytic Methods
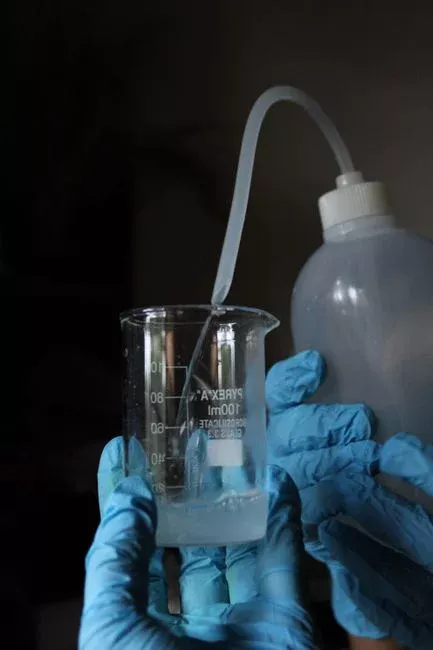
Electrocoagulation uses sacrificial Fe or Al anodes that release coagulant in situ; current density controls floc generation and Cu removal rate (Liu et al., 2023-02-22; MDPI Water, 2022). Electrowinning plates Cu²⁺ as metallic Cu on the cathode, turning a wastewater cost line into a metal-recovery revenue line (Liu et al., 2023-02-22). Photocatalysis with TiO₂ has reached ~80% Cu(II) removal in published studies; a 10² M Cu solution was fully removed in 3 h, and 50 mg TiO₂ at pH 5 gave 45.56% Cu removal in the MDPI Water 2022 review — pilot-scale, not yet mainstream.
The strengths are little or no added chemicals and a small footprint (MDPI Water, 2022). The weaknesses are high energy use and electrode wear for electrochemical methods, and reactor-design and lamp-fouling constraints for photocatalysis (MDPI Water, 2022). These methods are best scoped as targeted add-ons — recovery loops or polishing niches — rather than as full-train substitutes for precipitation at high influent Cu(II).
Biosorption, Bioprecipitation and Biomineralization
Biosorption uses dead or inactive biomass — algae, fungi, agricultural waste — to bind Cu²⁺ via surface functional groups, with agricultural-waste feedstocks keeping the media cost low (Liu et al., 2023-02-22). Bioprecipitation uses live microbial metabolism to drive CuS or Cu-phosphate precipitation, and biomineralization forms stable Cu-bearing mineral phases such as CuS with very low long-term leachability — a plus for landfill-bound residuals (Liu et al., 2023-02-22).
Status in 2026 is pilot or early-commercial — biosorption is not yet a drop-in replacement for precipitation at high Cu loadings, but it is attractive where sludge disposal is the binding constraint (Liu et al., 2023-02-22). The same review explicitly notes that achieving low-health-risk effluent through technology coupling, not single-method use, is the focus of future research. For a buyer scoping a 2026 retrofit, the right way to read this section is: budget the biological family as a niche or polishing option, sized to a defined stream, and validate with a column trial before committing CAPEX. An MBR integrated wastewater treatment system is the relevant adjacent building block if a biological polishing step is later added to the train.
Side-by-Side Comparison Matrix: Picking the Right Method
None of the academic reviews reviewed put a buyer's decision variables into one matrix. The table below does, anchored to the 2.5–10,000 mg/L influent range and the 1.3 mg/L U.S. EPA / ≤1.0 mg/L China surface-water targets cited in Liu et al. (2023-02-22). Bench anchors: UF >90% at 10–160 mg/L, pH 5.5–6 (MDPI Water, 2022); PEUF 97% (Liu et al., 2023-02-22); NF complete recovery at 1000 mg/L but drops at 2000 mg/L (MDPI Water, 2022); RO 70–99.9% (MDPI Water, 2022); ZnO-UF hybrid 92% with 88 mg/g at pH 8 (Liu et al., 2023-02-22); TiO₂ ~80% (MDPI Water, 2022).
| Method | Influent Cu(II) window | Typical effluent | pH window | By-product | CAPEX class | OPEX class | Key pain point |
|---|---|---|---|---|---|---|---|
| Chemical precipitation | High (upper 2.5–10,000 mg/L) | Mid-mg/L | Alkaline | Metal-bearing sludge | Low–Medium | Chemical + sludge | Sludge handling/disposal |
| Ion exchange | Low–Moderate (polish) | Sub-mg/L to ppb | Near-neutral | Acid/Cu eluent | Medium | Resin + regenerant | Regeneration chemistry |
| Adsorption | Low–Moderate | Sub-mg/L | Near-neutral to alkaline | Spent media | Low | Media replacement | Solid waste disposal |
| UF (hybrid/PEUF) | Low–Moderate (10–160 mg/L) | Sub-mg/L with polymer | 5.5–6 (UF alone) | Spent polymer/media | Medium | Membrane + polymer | Pretreatment SDI |
| NF | Moderate (≤1000 mg/L) | Sub-mg/L | 1.50–5 reported | Concentrate | Medium–High | Pressure + concentrate | Rejection drops at 2000 mg/L |
| RO | Low–Moderate (polish) | Sub-mg/L (70–99.9%) | Near-neutral | Concentrate | High | Energy + concentrate | High energy use |
| Electrochemical | Low–Moderate | Sub-mg/L; Cu metal product | Conductive | Sludge + Cu metal | Medium–High | Power + electrodes | Electrode wear, power |
| Biosorption | Low | Sub-mg/L | Near-neutral | Spent biomass | Low | Media replacement | Pilot-stage, not high-load |
No single row covers the full 2.5–10,000 mg/L influent range to a sub-mg/L target on its own — coupled trains are the norm, consistent with the technology-coupling direction flagged in Liu et al. (2023-02-22). A common 2026 default train: chemical precipitation at pH 9–10 → lamella clarifier for copper-hydroxide settling → multi-media filter for RO pretreatment on a copper train → ion exchange or NF/RO polish, sized to hit the 1.3 mg/L U.S. EPA or ≤1.0 mg/L China surface-water target. The capital cost drivers the literature actually documents are influent pH, Cu concentration, competing ions, target effluent, operating cost, and environmental compatibility of each method (MDPI Water, 2022).
Decision Framework: How to Choose Your 2026 Copper Train
- Characterise the feed. Measure total Cu, pH, flow rate, competing ions (Ca²⁺, Mg²⁺, Na⁺), and temperature, and lock down the target effluent. Start the target conversation at 1.3 mg/L (U.S. EPA), 3 mg/L (WHO), or ≤1.0 mg/L (China GB 3838-2002) per Liu et al. (2023-02-22).
- Pick the primary method. Precipitation belongs in the upper part of the 2.5–10,000 mg/L range reported in Liu et al. (2023-02-22), where the cost per kilogram of Cu removed is lowest and the goal is volume reduction. Ion exchange or adsorption fits when the influent is already below 100 mg/L.
- Pick the polish. Ion exchange or RO/EDI reaches sub-mg/L or ppb targets; NF is the middle-ground pressure option when influent is ≤1000 mg/L and the rejection drop at 2000 mg/L is not in play (Liu et al., 2023-02-22; MDPI Water, 2022).
- Decide on Cu recovery. If Cu has market value — typical in electroplating rinse water — add electrowinning or a Cu-selective ion-exchange elution loop to turn the polish stream into a revenue line (Liu et al., 2023-02-22).
- Close the sludge and concentrate loops. Route hydroxide sludge to a plate and frame filter press for copper-bearing sludge for dewatering, and route RO or ion-exchange concentrate to evaporation or crystallisation. A DAF machine upstream of precipitation helps when co-precipitated oils or surfactants are present.
Liu et al. (2023-02-22) explicitly endorse technology coupling as the focus of future research for low-health-risk effluent — match that logic when justifying a multi-stage CAPEX in front of finance. For peer comparisons on adjacent metals, see our nickel removal methods comparison for 2026 and chromium removal methods comparison for 2026. For fabricated-metals sites weighing clarification choices, the DAF vs clarifier for fabricated metals wastewater in 2026 guide and the 2026 sewer pretreatment guide for mining and metals plants are the adjacent reads.
Frequently Asked Questions
Which copper removal method should I pick for a 2026 retrofit?
Use the decision framework: start with chemical precipitation when influent sits in the upper part of the 2.5–10,000 mg/L range reported in Liu et al. (2023-02-22), then add ion exchange, NF, or RO polish to hit the 1.3 mg/L U.S. EPA or ≤1.0 mg/L China GB 3838-2002 target. The single-method approach rarely covers the full 2.5–10,000 mg/L range to a sub-mg/L target — coupled trains are the 2026 default.
What influent Cu(II) range is chemical precipitation best suited for?
Precipitation is the lowest cost-per-kilogram option at the high end of the 2.5–10,000 mg/L range (Liu et al., 2023-02-22), but it leaves effluent in the mid-mg/L band and produces a metal-bearing sludge that must be dewatered. Below ~100 mg/L, ion exchange or adsorption usually beats precipitation on total cost because the chemistry dose drops out of the operating budget.
How much does a copper-removal train cost to build and run?
The academic sources reviewed do not publish a price for a complete copper train — capital and operating cost are driven by influent pH, Cu concentration, competing ions, target effluent, and environmental compatibility (MDPI Water, 2022), which are site-specific. A buyer should request a sized proposal with documented influent characterisation, target effluent in mg/L, and a mass balance on sludge and concentrate before comparing quotations.
How do I pick a copper-removal equipment supplier in 2026?
Ask each supplier for a written influent characterisation protocol, a mass balance across the proposed train (precipitation → clarification → multimedia filter → ion exchange or RO), and a documented sludge-and-concentrate handling plan. Verify the supplier can size the polish stage against the 1.3 mg/L U.S. EPA or ≤1.0 mg/L China GB 3838-2002 target cited in Liu et al. (2023-02-22) and can demonstrate the lead time for the chosen ion-exchange resin or RO element on a 2026 delivery schedule.