What cooling-blowdown treatment does a Kumasi data center actually need?
A data center in Kumasi, Ghana needs a four-part water management plan: (1) pre-treatment of municipal or borehole makeup to reduce total dissolved solids before the cooling tower, (2) cooling-tower operation disciplined by cycles of concentration (typically 4 to 6) with Langelier Saturation Index held between −0.5 and +0.5, (3) blowdown treatment — physicochemical clarification, MBR biological polishing, or reverse-osmosis recovery at 50–85% — to control TDS, temperature (30–40°C), biocides, antiscalants, and metals, and (4) either NPDES-style compliant discharge or on-site reuse. The hyperscale benchmark of 1.14–1.70 million litres per day must be rescaled to a 1–10 MW edge facility. The article does not have Ghana-specific intake data, so the engineer should confirm municipal TDS, ambient wet-bulb, and Ghana EPA effluent limits before final sizing.
Right-sizing starts with the heat load, not the flow. Using Ecologix's evaporation relation E = (Heat Load × 860) / (ΔHvap × η), a 50 MW heat load at 80% efficiency produces ≈99,537 kg/h of evaporation (S1). A 1 MW rack cluster rejects a fraction of that — typically 1–5 MW of heat to the tower once PUE is applied — so the engineer should expect daily evaporation in the low thousands of litres per hour, not the 47,000–70,000 L/h implied by the hyperscale range. The 1.8 L/kWh WUE benchmark in S1 stays useful as a sanity check: a 5 MW IT load at 1.8 L/kWh over 24 h gives 216,000 L/day of total water demand, of which ~60% evaporates and the rest becomes blowdown plus drift. The four-part plan above scales linearly with that envelope, but the equipment list must be modular rather than hyperscale-procured — a point Genesis makes explicitly: a 5 MW colocation site trying to copy 100 MW RO and ion-exchange trains pays 3–4× more per gallon treated (S4).
Before any procurement, the engineer must collect three local inputs: Ghana Water Company Limited (GWCL) supply TDS or borehole analysis, ambient wet-bulb at the site (Kumasi's humid-tropic conditions reduce effective tower ΔT relative to the arid baselines in S1), and current Ghana EPA effluent limits for the receiving sewer or surface water. The remainder of this article treats these as variables to be confirmed, not numbers to be assumed.
Sizing the water balance: makeup, evaporation, drift, and blowdown
The mass balance M = E + B + D, where D is drift (~0.02% of circulation), and B = E / (COC − 1), is the single most useful calculation a Kumasi engineer will run (S1). The Ecologix example — 50 MW at η=0.8, E ≈ 99,537 kg/h — is included here as a worked template, not a Kumasi prediction. For a 1–10 MW edge site, the same equation applied to the site's measured heat load gives evaporation directly; blowdown then falls out from the chosen COC.
Increasing COC is the cheapest CAPEX lever because it reduces blowdown volume and therefore the size of every downstream unit operation. Genesis highlights a calculation that is often misread: moving from 4 COC to 6 COC does not halve blowdown. At 4 COC, blowdown is 1/(4−1) ≈ 33% of makeup, often rounded to 25–30% in practice; at 6 COC it is 1/(6−1) = 20% — a 5-percentage-point reduction, roughly a 20% improvement in blowdown volume, not 50% (S4). Above 5–6 COC, biological and scaling risks rise non-linearly, often forcing operations back down. The realistic target for a Kumasi tower on treated municipal or borehole water is therefore 4–6 COC with disciplined antiscalant and biocide dosing, not 7+.
Evaporative losses are about 60% of total cooling-tower water demand (S1); the remaining 40% is the recoverable stream — blowdown plus drift — and is the design basis for any treatment plant. Blowdown quality is well-characterized in the literature: TDS up to 2,000 ppm, effluent temperature 30–40°C, with accumulated biocides, antiscalants, molybdate corrosion inhibitor, and leached copper and zinc (S1). Those are the parameters the downstream train must handle. A 10 MW facility on evaporative cooling at 4 COC might intake on the order of 15 million gallons per month and discharge roughly a quarter of that as blowdown (S4); for a smaller Kumasi site the same percentages apply, but the absolute volumes are an order of magnitude lower, which is why modular 100–300 GPM side-stream and polish trains are the right size, not hyperscale RO skids (S4).
Pre-treatment for Kumasi intake: screens, softening, and reverse osmosis
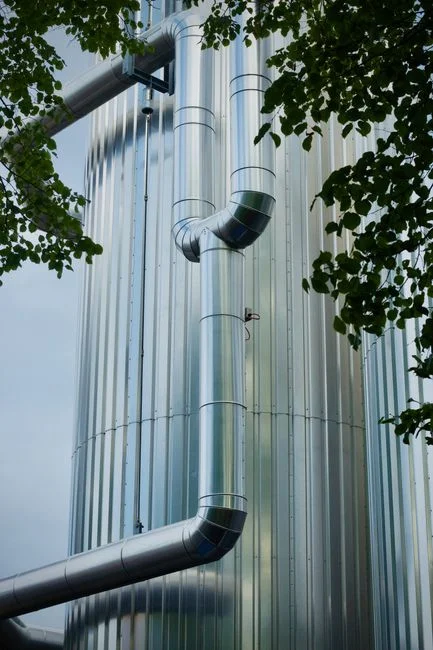
The makeup side determines everything downstream. If the cooling tower is fed with hard, high-TDS water, blowdown will exceed the 2,000 ppm threshold faster and force a larger, more expensive treatment train. A typical pre-treatment sequence begins with coarse screens or multimedia filters at 5–10 μm, followed by either RO modules targeting ~75% recovery or ion-exchange softeners for hardness control (S1). For RO, the governing flux equation is Jw = A(ΔP − Δπ), where Δπ ≈ 0.4 MPa for a 500 ppm TDS feed (S1). Inline sensors and dosing pumps adjust pH and dose antiscalant to hold the Langelier Saturation Index between −0.5 and +0.5, with the Ryznar Stability Index (RSI = 2pHs − pH) used alongside LSI because LSI alone can under-predict corrosion risk (S1).
Softener chemistry follows the equilibrium Ca²⁺ + 2HCO₃⁻ ⇌ CaCO₃↓ + CO₂ + H₂O, and the dose requirement should be confirmed by jar testing on the actual Kumasi supply rather than calculated from assumed hardness. A multi-media filter as RO pretreatment protects the membranes from particulate fouling, and a twin-tank softener for hardness control stabilizes LSI before the tower. Where space or chemistry favours RO makeup, an industrial RO system for data center makeup cuts TDS aggressively and reduces blowdown loading, at a CAPEX premium of up to roughly $1.0/m³ of treated water that the engineer should weigh against the avoided scaling risk (S1).
| Pre-treatment step | Equipment | Operating target | Source |
|---|---|---|---|
| Particulate removal | Coarse screens, multimedia filter (5–10 μm) | SDI < 5 before RO | S1 |
| TDS reduction | RO modules, 75% recovery | Δπ ≈ 0.4 MPa at 500 ppm feed | S1 |
| Hardness control | Ion-exchange softener | LSI held −0.5 to +0.5; RSI monitored in parallel | S1 |
| Chemical dosing | Phosphonate antiscalant, pH adjuster, biocide | Continuous metering; chemistry carried into blowdown | S1 |
The often-overlooked point: antiscalant and biocide dosed at the makeup side do not disappear. They concentrate in the tower and exit in the blowdown, so the downstream train must plan for chemical loading, not just TDS and temperature.
Choosing the blowdown treatment train for a tropical edge facility
Four train archetypes are realistic for a 1–10 MW Kumasi edge site. The right choice depends on the discharge route, the reuse opportunity, and the available operator skill — not on which technology is newest.
Physicochemical (coagulation → DAF/clarifier → precipitation). Dose is set by jar testing as Dose = (Turbidity × Q)/η; flocculation is governed by the velocity gradient G = √(P/μV); DAF or clarifier separation follows Stokes' law vs = g(ρp − ρf)d²/18μ; lime precipitation in agitated reactors removes 90–95% of metals (S1). This train is fast, robust on variable loads, and is the right starting point when blowdown is high in suspended solids and metals rather than dissolved organics. A DAF unit for cooling-tower blowdown clarification handles the bulk separation, and a filter press for blowdown sludge dewatering handles the residual.
MBR biological polishing. Equalization → aeration (F/M ratio and OUR control, MLSS 2,000–4,000 mg/L) → MBR with UF at J = Q/A, fouling managed by dR/dt = kp·J·Cb and backwash cycles (S1). MBR delivers 95–99% COD/BOD removal and is modular, which suits a 1–10 MW site. A modular MBR for blowdown polishing with a UF pretreatment for RO membrane protection downstream gives the cleanest effluent for reuse polishing.
RO blowdown recovery. Recovery rates of 50–85%, permeate at 10–50 mg/L TDS, concentrate returned to the blowdown stream (S5). This is the highest-value option when the goal is to return permeate to the cooling tower as makeup, and is the architecture Genesis recommends when water stress or discharge fees make reuse economic. Side-stream filtration CAPEX runs $50,000–$200,000 for typical data center installations, with minimal opex beyond solids disposal (S5).
Closed-loop with glycol. Makeup below 5% annually, no liquid discharge, but footprint and grid reliability for the recirculation pumps matter (S1). For a Kumasi edge site with intermittent power, this is operationally harder than an RO polish train.
| Train | Best fit for Kumasi 1–10 MW | Recovery / removal | Key equipment | Source |
|---|---|---|---|---|
| Physicochemical (DAF + precipitation) | High-TDS, high-metal blowdown; discharge to sewer | 90–95% metals removal | Coagulation, DAF, lime reactor, sludge dewatering | S1 |
| MBR biological polish | Variable blowdown with biodegradable additives; reuse polishing | 95–99% COD/BOD | Equalization, aeration, MBR with UF | S1 |
| RO blowdown recovery | Cooling-tower makeup reuse; water-stress or high discharge-fee sites | 50–85% recovery; permeate 10–50 mg/L TDS | Side-stream filter, RO/NF, concentrate handling | S5 |
| Closed-loop glycol | Footprint-constrained, grid-reliable sites | <5% makeup annually | Storage tanks, pumps, chillers, heat exchangers | S1 |
The right sizing call, per Genesis, is a modular 100–300 GPM blowdown treatment system rather than a copy of a hyperscale RO/ion-exchange train — capital cost per gallon treated is 3–4× higher at smaller scale when hyperscale designs are forced onto edge sites (S4).
Discharge, reuse, and Ghana-specific operating constraints
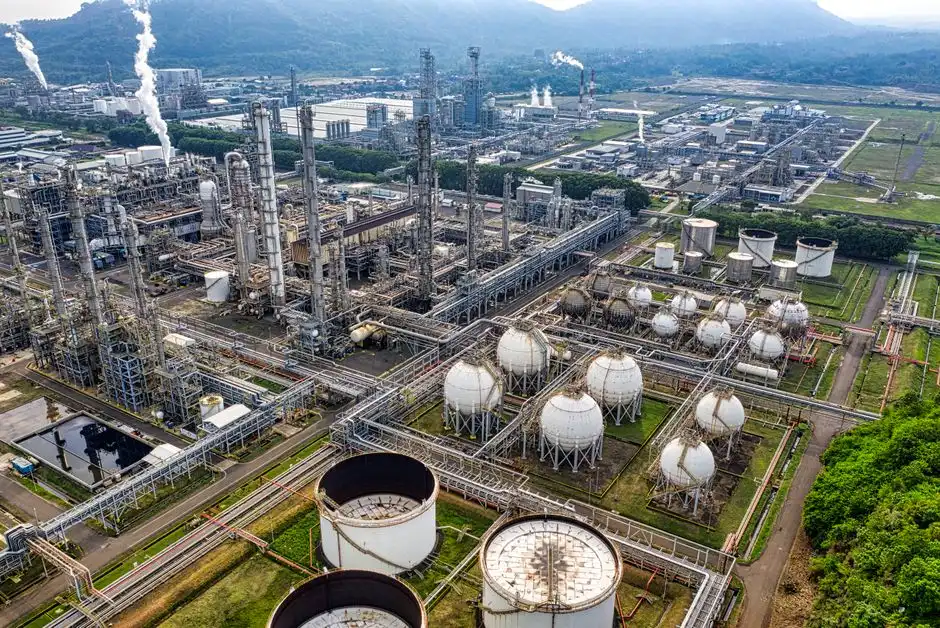
Ecologix identifies three conditions that turn on-site blowdown treatment into a mandatory CAPEX rather than an optional sustainability upgrade: (1) effluent exceeds municipal limits for TDS (e.g., >2,000 ppm) or temperature ΔT > 5°C; (2) the site is in a water-scarce area and commits to zero-liquid discharge or high-recovery recycling; or (3) the local municipal WWTP cannot accept the daily blowdown volume of 1.14–1.70 million litres (S1). For a Kumasi site, the engineer should not assume these thresholds transfer directly. The translation step is to take the three triggers to the Ghana EPA — confirm the local TDS limit, the temperature-delta limit, and the receiving sewer or surface water's capacity — before sizing any train. The article does not have those Ghana-specific numbers, and they are operator inputs, not assumptions.
Reuse targets are well-defined in the literature even when the local discharge rules are not. Closed-loop designs limit makeup to less than 5% annually (S1). Side-stream filtration plus a two-stage physical-plus-polish train can cut fresh cooling-tower makeup by 15–25% by routing treated blowdown to irrigation, toilet flushing, or equipment washdown (S4). For higher-value reuse, RO polish returns permeate to the cooling tower at 10–50 mg/L TDS (S5). Disinfection of any reuse stream is typically handled by a ozone generator or a chlorine dioxide generator, both of which avoid the bromate formation risk that chlorine poses on high-TDS, high-bromide water.
Two Kumasi-specific constraints deserve a flag rather than a fabricated number. First, humid-tropic operation raises the ambient wet-bulb above the arid baselines that S1 implicitly assumes, which reduces effective tower ΔT and increases required approach — the engineer must request site wet-bulb data before final sizing. Second, grid reliability in Ghana affects RO and high-pressure pump operation; sequence controls and treated-water storage should be planned, but the engineer must confirm the local substation statistics with the utility rather than assume them. Both points are operator inputs, not assumptions this article can fill.
Capital cost, OPEX, and ROI for a Kumasi-scale blowdown plant
Procurement numbers from the research need to be carried into the Kumasi business case as ranges, not as point estimates. Side-stream filtration CAPEX runs $50,000–$200,000 for typical data-center installations, depending on flow rate (S5). Direct discharge fees in water-stressed regions are reported at $5–15 per thousand gallons (S5) — confirm the Kumasi sewer-utility tariff before sizing, because a low local tariff can swing the ROI math against reuse. Full zero-liquid discharge CAPEX is $3–8 million for data-center scale (S5), which is almost certainly uneconomic at 1–10 MW in Ghana; partial ZLD or RO polish is the realistic path. A PLC-controlled dosing system for antiscalant and biocide is a comparatively small line item that materially affects both the chemistry of the blowdown and the operability of every downstream unit.
Genesis's worked example is useful as a template: a 15 MW facility spending $200,000 on a 60% blowdown-recovery system sees a ~6.7-year simple payback on water alone, improving to 3–5 years once avoided discharge fees, regulatory exposure, and stakeholder cost are included (S4). The same logic applied to a smaller Kumasi site requires the engineer to substitute the local recovery volume, the local discharge tariff, and the local water rate — none of which the research provides for Ghana — before quoting a payback number. The defensible move is to present the range, identify the local inputs, and refuse to invent a Ghana-specific payback figure. The decision rule is straightforward: if local discharge fees and water rates together exceed the annualized CAPEX plus opex of a modular RO polish train at 50–85% recovery (S5), reuse wins; otherwise physicochemical DAF followed by sewer discharge is the lower-risk path.
Frequently Asked Questions
What cycles of concentration should a Kumasi data center target?
Target 4–6 COC with disciplined antiscalant and biocide dosing (S1). The marginal blowdown reduction from 4 to 6 COC is about 5 percentage points — roughly 33% to 20% of makeup — not 50%, and biological and scaling risks rise non-linearly above 5–6 COC (S4). Above 6, expect to fight fouling and microbiologically influenced corrosion unless advanced treatment is in place.
How much does a data-center blowdown treatment plant cost in Ghana?
Plan on $50,000–$200,000 for a side-stream filtration system sized to data-center flow rates (S5). A full zero-liquid discharge train runs $3–8 million and is rarely justified below 10 MW (S5). A modular RO polish train at 50–85% recovery sits between those two and is the realistic middle path; the engineer must still confirm the local discharge tariff and water rate in Kumasi to convert CAPEX into a defensible payback.
Is discharge to the Kumasi sewer allowed, or is on-site treatment mandatory?
On-site treatment becomes mandatory when effluent exceeds local TDS or temperature-delta limits, when reuse or ZLD is required by scarcity, or when the receiving WWTP cannot accept the daily volume (S1). Confirm the analogous Ghana EPA thresholds and the receiving sewer's capacity with the regulator before sizing; do not assume the NPDES-style numbers transfer directly.
Which equipment fits a 1–10 MW edge data center in Kumasi?
Right-size with modular units rather than hyperscale skids: a multi-media filter and a twin-tank softener for makeup pre-treatment, a DAF unit for blowdown clarification, a modular MBR for biological polishing, a containerized RO for high-recovery reuse, a filter press for sludge dewatering, and a PLC-controlled dosing system to hold LSI between −0.5 and +0.5 (S1, S4, S5).
What influent and effluent data do I need before sizing the plant?
Request: GWCL or borehole supply TDS and hardness, full ionic analysis for LSI/RSI calculation, ambient wet-bulb at the site (Kumasi's humid-tropic conditions shift the tower's effective ΔT), current Ghana EPA effluent TDS, temperature, and metals limits, the measured blowdown volume and target recovery percentage, and the local sewer tariff and water rate. These are operator inputs — none of them can be assumed from generic literature, and the sizing calculation is only as good as the numbers behind it (S1, S4).