
Meat Processing Wastewater: Why Standard MBR Design Fails
Meat processing wastewater characteristics break generic MBR design assumptions. The substrate is high-strength, high-fat, and chloride-dominant: COD 3,000–8,000 mg/L, BOD 1,500–4,000 mg/L, FOG 2,000–5,000 mg/L, TSS 1,000–3,000 mg/L, TKN 300–800 mg/L, and TP 50–150 mg/L (S2 substrate analysis). More than 50% of the total solids are ash, and nearly 60% of that ash is chloride — a salt shock that suppresses non-halotolerant microbes, lowers methane solubility in anaerobic configurations, and forces acclimated consortia to dominate (S2, MDPI Fermentation 2025).
Carbohydrate is low and fat is high because most load originates from cooking rather than slaughter. Fat floats rather than settles, smears membrane surfaces, and blocks pores. The same study reported unusually low Pseudomonadota abundance, a direct consequence of the C:N:P stoichiometry being skewed by lipid-rich substrate (S2). Batch cleaning cycles and seasonal swings make the influent non-stationary: equalization must absorb 2–3× peak hourly flow or downstream biology collapses. Any MBR sized on municipal curves will foul inside six months on this stream.
| Parameter | Typical Range | Design Implication |
|---|---|---|
| COD | 3,000–8,000 mg/L | High OLR; favors anaerobic + membrane |
| BOD/COD ratio | 0.45–0.55 | Biodegradable; rapid biological uptake |
| FOG | 2,000–5,000 mg/L | DAF mandatory; risk of pore blocking |
| Chloride (as Cl⁻) | 5–15 g/L | Halotolerant inoculum required |
| Ash fraction of TS | >50% | High inorganic load; abrasion risk |
| Variability (peak/avg) | 2–3× | Equalization 8–12 hr HRT |
Source: S2 substrate analysis (MDPI Fermentation, 2025-02). Equipment context: DAF system for FOG removal and fine screening (1–2 mm) for meat wastewater.
Pretreatment Train: Non-Negotiable Membrane Protection
Skipping pretreatment is the single most common reason MBR membranes fail in slaughterhouse and meat processing service. Fats coat membranes irreversibly within 3–6 months when the upstream train is incomplete, and a single CIP recovery rarely restores flux. The minimum train, in order, is rotary drum screen, DAF, equalization, and chemical dosing.
A rotary drum screen at 1–2 mm aperture removes bone, hair, and plastic that would otherwise shred pump impellers and accumulate in the DAF float. HydropureWater GX-series drum screens handle fibrous debris with a self-cleaning brush and integrated screw compaction, keeping screenings below 30% moisture. Sized for peak hourly flow, not average.
The DAF unit is the membrane's primary defense. HydropureWater DAF units achieve 95%+ FOG removal across 4–300 m³/h using micro-bubble saturation and automatic skimming, which is the proven envelope for food-processing fat loads. Size the DAF for 2× the peak FOG load — surface hydraulic loading of 5–10 m³/m²/h is typical, and saturator recycle is 20–30% of forward flow. Under-sizing by 25% is a typical field mistake that returns as 3× CIP frequency within the first year.
Equalization tanks run 8–12 hr HRT with coarse-bubble mixing to keep fat emulsified and prevent solidification on tank walls. They dampen pH swings (raw influent can hit 5–10) and temperature swings (15–45°C) from CIP discharges. Pre-precipitation with FeCl₃ or PAC at 50–150 mg/L pulls 60–80% of the phosphate before the biological stage and reduces struvite risk downstream. A PLC-controlled chemical dosing skid tied to flow-proportional metering cuts coagulant waste by 15–25% versus manual dosing. In-line pH correction to 7.0–7.5 protects nitrifiers and prevents fat saponification in the MBR.
AnMBR vs AeMBR: Configuration Decision Framework
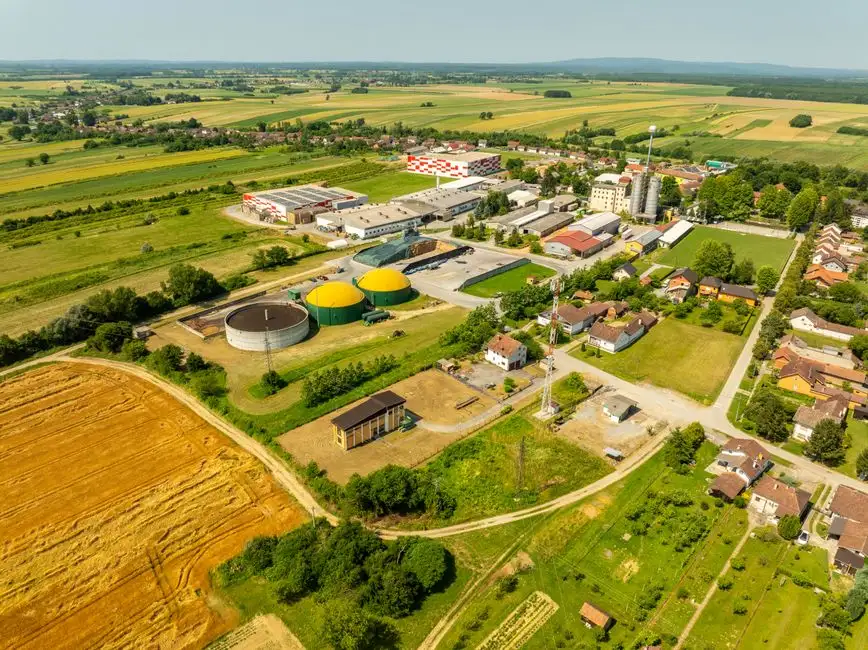
Both configurations work on meat wastewater, but they trade energy for effluent quality in opposite directions. The decision matrix below comes from S2 operating data and S5 cost comparisons.
AnMBR runs at 37°C mesophilic with 15–25 day SRT, 0.5–1.5 kg COD/m³/d OLR, and a submerged membrane flux of 5–8 LMH. Biogas yield reaches 0.35–0.45 m³/kg CODremoved at 60–70% CH₄ (S2). The same study reported a net energy benefit of 0.13–5.1 kWh/m³ and a 49% energy cost reduction when permeate reuse is credited. The downside: effluent quality. Permeate COD averages ~900 mg/L (10× the Austrian discharge limit of 90 mg/L), NH₄-N ~210 mg/L (42× the 5 mg/L limit), and total phosphorus ~211 mg/L (211× the 1 mg/L limit) — all measured from the same reactor, not worst case (S2). AnMBR permeate needs RO/NF polishing to be compliant.
AeMBR runs at ambient temperature with 10–15 g/L MLSS, 6–10 hr HRT, 15–25 day SRT, and design flux of 8–12 LMH. Effluent COD is consistently below 20 mg/L and TN under 15 mg/L when an anoxic zone is included for denitrification. Aeration energy runs 0.8–1.2 kWh/m³ versus 0.1–0.3 kWh/m³ for AnMBR scouring air, a 70–80% increase. PVDF flat sheet membrane modules at 0.1 μm cut energy 10–20× below cross-flow tubular designs.
| Driver | Choose AnMBR | Choose AeMBR |
|---|---|---|
| Energy priority | Net energy positive (0.13–5.1 kWh/m³) | Net consumer (0.8–1.2 kWh/m³) |
| Effluent nitrogen | Requires post-treatment (NH₄-N ~210 mg/L) | TN <15 mg/L with anoxic zone |
| Footprint | Requires digester + membrane tank | Single tank; 40% smaller |
| Chloride tolerance | 5–15 g/L with acclimated biomass | Dilution or halotolerant seed needed |
| CAPEX premium | 15–20% higher (heating + mixing) | Lower |
| Best for | >1,000 m³/d plants with CHP | Small/medium plants, strict N limits |
Selection rule of thumb: if biogas utilization already exists orcan be installed, AnMBR pays back in 3–5 years. If discharge nitrogen limits are under 15 mg/L and there is no heat load, AeMBR delivers simpler compliance. An integrated MBR system (10–2,000 m³/day) with PVDF submerged modules is the standard AeMBR package; AnMBR is typically configured as separate digester + membrane skid.
MBR Design Parameter Table for Meat Wastewater
The numbers below are starting points for front-end engineering. All are derived from S2 operating data, S5 design parameters, and standard MBR practice applied to high-fat, high-salt substrate.
| Parameter | AnMBR Value | AeMBR Value | Design Basis |
|---|---|---|---|
| Membrane flux (submerged) | 5–8 LMH | 8–12 LMH | FOG fouling propensity; lower for AnMBR |
| Hydraulic retention time | 12–24 hr (biological) | 6–10 hr (biological) | Slower anaerobic kinetics |
| Solids retention time | 15–25 days | 15–25 days | Halotolerant biomass retention |
| MLSS | 8–12 g/L | 10–15 g/L | Higher in AeMBR for nitrification |
| Aeration intensity | 0.2–0.4 m³/m²/h (scouring only) | 0.5–0.8 m³/m²/h (process + scouring) | AnMBR has no process O₂ demand |
| Operating temperature | 35–38°C | 15–35°C | Mesophilic vs ambient |
| Membrane pore size | 0.1–0.4 μm | 0.1 μm (PVDF) | Submerged ultrafiltration |
| Membrane area per unit | 80–225 m² | 80–225 m² | DF module standard sizes |
| Peak flow safety factor | 1.2× | 1.2× | Area = peak flow / design flux × SF |
| CIP frequency | 2–4×/year | 2–4×/year | NaOCl + citric acid recovery |
For sizing: peak flow in m³/hr ÷ design flux in LMH ÷ 1,000 × 1.2 = required membrane area in m². DF-series modules come in 80, 120, 150, and 225 m² sizes; use 150 m² as the typical building block for 50–200 m³/hr meat processing flows.
Effluent Polishing: Bridging the Compliance Gap
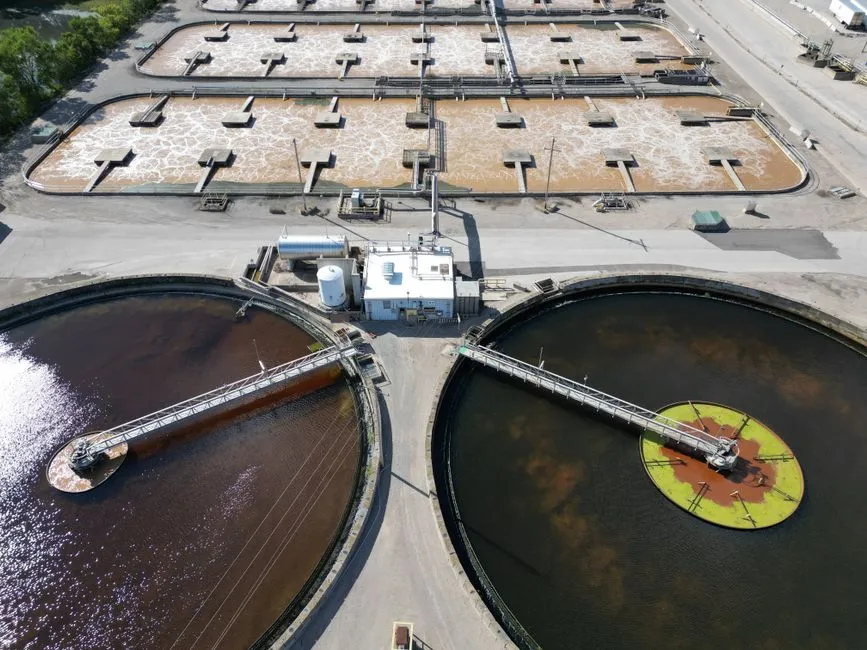
Neither AnMBR nor AeMBR permeate meets typical discharge limits on its own. The compliance gap is specific and quantifiable. S2 reported AnMBR permeate at COD ~900 mg/L (limit 90 mg/L), NH₄-N ~210 mg/L (limit 5 mg/L), and P ~211 mg/L (limit 1 mg/L) — exceeding limits by 10×, 42×, and 211× respectively. AeMBR closes the COD and TN gap but leaves phosphorus at 2–5 mg/L versus a 1 mg/L limit.
For AnMBR permeate, RO/NF is the only practical option. RO achieves 99% salt and COD removal at 75% recovery, dropping COD below 5 mg/L, TN below 1 mg/L, and P below 0.1 mg/L. Concentrate volume is 25% of feed and must be managed — typically via evaporation or further crystallization for ZLD designs. RO polishing is the standard for water reuse targets, producing effluent suitable for process washdown, cooling tower makeup, and boiler feed with minimal further conditioning.
For AeMBR permeate, polishing is simpler. Chemical phosphorus precipitation with FeCl₃ at 10–20 mg/L (molar ratio Fe:P ≈ 1.5–2:1) drops P to below 1 mg/L, followed by a lamella clarifier and a multimedia filter for residual solids and TSS polishing. This is the lowest-CAPEX path when discharge (not reuse) is the endpoint and nitrogen is already in spec.
Reuse path summary: AnMBR + RO produces <5 mg/L COD, <0.1 mg/L P, <1 mg/L TN — directly usable for non-contact process water. AeMBR alone typically does not reach reuse-grade phosphorus without the precipitation train.
Energy Balance & Biogas Integration
AnMBR's economic case is the energy balance, and it is quantifiable from operating data. A 1,000 m³/day plant treating 5,000 mg/L COD with 90% removal generates roughly 4,500 kg CODremoved/day, producing 1,575–2,025 m³/day biogas at 0.35–0.45 m³/kg CODremoved and 60–70% CH₄ content (S2). At 35.8 MJ/m³ CH₄ LHV, that is 9,500–12,200 kWh/day thermal energy, or 3,800–4,900 kWh/day electricity at 40% CHP conversion. S5 reported boilers and co-generators consuming 75% and 25% of produced biogas respectively, supplying 50% of total WWTP electricity demand.
AeMBR inverts this balance. Aeration alone draws 0.8–1.2 kWh/m³, and there is no biogas offset. For a 1,000 m³/day plant, that is 800–1,200 kWh/day net energy purchase. Strategies to cut MBR energy use 20–81% focus on fine-bubble diffuser efficiency, DO control at 1.5–2.0 mg/L rather than 2.5 mg/L, and intermittent aeration tied to NH₄-N load.
For AnMBR, the 37°C effluent stream is itself an asset. A spiral-wound heat exchanger on the MBR permeate can preheat raw influent from 20°C to ~30°C, cutting digester heating duty 30–40%. Further detail on AnMBR energy optimization tactics covers CHP sizing, gas holder volume, and flare minimization.
CAPEX/OPEX Levers: Where Money Moves
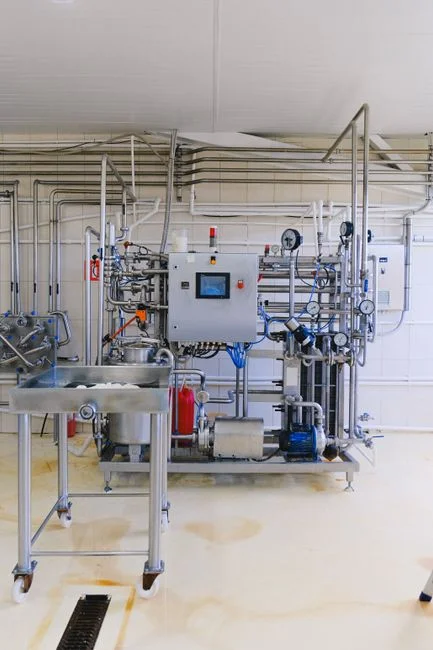
S5 ranked total cost as MBR > A²O > IFAS > MBBR, but found MBR had the lowest energy and material OPEX of the four, with biological treatment cost lowest for MBR. The most sensitive cost variable is construction cost: S5 reported total cost and present worth show the greatest sensitivity to construction cost changes. Modular packaged MBR units cut civil works 40–60% versus field-built concrete tanks, which is where packaged MBR skids deliver disproportionate value.
For a 10-year total cost of ownership, MBR frequently wins on OPEX even when it loses on CAPEX, because biological stability is higher (no clarifier failures, no bulking sludge) and effluent is more consistent. Membrane replacement is the largest non-energy OPEX line: budget 15–20% of equipment cost per replacement cycle, with 7–10 year membrane life at 8–12 LMH flux. Automated CIP (clean-in-place) systems cut chemical cleaning labor by roughly 50% and are standard on packaged units. For a deeper MBR CAPEX/OPEX breakdown per m³, the 2025 cost reference remains the standard benchmark.
Frequently Asked Questions
What MBR flux rate for meat processing wastewater?
8–12 LMH for AeMBR and 5–8 LMH for AnMBR in submerged configuration. These are 30–50% below municipal wastewater flux because FOG coats membranes faster than soluble COD alone. Operating above these ranges typically cuts membrane life from 8 years to 3–4 years and increases CIP frequency from 2× to 6–8× per year.
Can MBR handle high chloride meat wastewater?
AnMBR tolerates 5–15 g/L Cl⁻ with acclimated halotolerant biomass; this is the configuration typically used for cured-meat processors (S2). AeMBR struggles above 5 g/L Cl⁻ without dilution or halotolerant seed, and nitrification efficiency drops sharply above 8 g/L. If chloride exceeds 10 g/L and the plant is small, AnMBR is the more robust choice despite the polishing burden.
Does MBR remove nitrogen from meat wastewater?
AeMBR with a dedicated anoxic zone (pre-anoxic + internal recycle at 3–4×) achieves TN below 15 mg/L. AnMBR effluent is dominated by NH₄-N (roughly 210 mg/L per S2) and requires post-treatment — typically a partial nitritation/Anammox sidestream, or RO polishing for water-reuse cases.
What pretreatment is mandatory before MBR?
A 1–2 mm rotary drum screen followed by DAF for FOG removal and an 8–12 hour equalization tank. Skipping any of these causes irreversible membrane fouling in under 6 months on meat processing substrate. Chemical dosing for phosphate pre-precipitation is recommended, not optional, when influent TP exceeds 50 mg/L.
AnMBR or AeMBR for energy recovery?
AnMBR is the only configuration with a positive net energy balance: 0.13–5.1 kWh/m³ depending on influent strength, temperature, and CHP efficiency (S2). AeMBR is a net energy consumer at 0.8–1.2 kWh/m³ aeration. Choose AnMBR when biogas utilization (CHP, boiler, or gas grid injection) is in place and flow exceeds roughly 500 m³/day; below that, AeMBR with effluent reuse usually has lower lifecycle cost.