Why Food Processing Wastewater Breaks Generic Dosing Rules
A coagulant dosing system for food processing must absorb 200-500% influent load swings from CIP cycles and seasonal production while keeping EPA 40 CFR 432/405 effluent limits — a demand that defeats the flow-paced architectures still common in vendor proposals. The cost of getting it wrong is concrete: over-dosing burns 20-40% of chemical OPEX and inflates sludge haul-off, while under-dosing triggers BOD/TSS surcharge penalties of $0.30-0.80/lb at most POTWs. The underlying problem is that food-plant influent is fundamentally non-stationary. Empirical dosing models based only on flow and effluent turbidity produce a correlation coefficient of just 0.58 between predicted and actual dose (S1, Springer Berlin Heidelberg, 1994) — meaning the controller is wrong by tens of percent for most of the operating day. Adding 2-6 hours of sedimentation/DAF lag (S1) makes feedback-only control react too late for a 30-90 minute CIP spike, so the dose that arrives at the floc tank was tuned for water that left the plant two hours earlier.
| Sector | COD (mg/L) | TSS (mg/L) | O&G (mg/L) | Protein (mg/L) | Dominant variability driver |
|---|---|---|---|---|---|
| Meat/poultry | 5,000-15,000 | 1,500-5,000 | 500-2,000 | 1,000-3,000 | Blood/paunch spikes, slaughter-shift CIP |
| Dairy | 2,000-8,000 | 500-2,500 | 200-1,000 | 500-2,000 | Cheese whey / CIP acid-caustic pH swings |
| Produce/canning | 1,000-6,000 | 800-3,000 | 100-500 | 200-800 | 6-month seasonal campaign (tomato, fruit) |
| Beverage/brewery | 3,000-10,000 | 500-2,000 | 100-400 | 200-600 | Batch fermenter turnarounds, spent grain |
Regulatory exposure compounds the variability. EPA 40 CFR 432 caps meat/poultry discharges at BOD5 250 mg/L, TSS 275 mg/L, and O&G 100 mg/L; 40 CFR 405 governs dairy (per EPA guidelines, 2026). POTW surcharges compound: a 5 mgd plant paying $0.50/lb over a 200 mg/L BOD excursion can burn $150K-500K/yr on a single permit cycle. That is the financial envelope any dosing-system specification must protect.
Coagulant Dosing System Architecture: From Sensor to Injection Point
The hardware stack for a food-plant dosing skid has five functional layers, each of which must be specified explicitly in the RFQ. At the instrumentation layer, a streaming current detector (SCD) measures floc charge directly with a target window of ±5 mV around the charge-neutralization endpoint; UV254 (0.05-0.3 cm⁻¹ range) proxies NOM and protein content; pH, temperature, and conductivity round out the influent fingerprint; and a magmeter (±0.5% accuracy) provides the flow signal that every control strategy depends on (S1, S3). The controller is a PLC — Allen-Bradley CompactLogix or Siemens S7-1500 are the de facto standards — running PID plus feed-forward blocks, with an HMI that stores CIP recipes, trend data, and alarm logs, and exposes Modbus TCP or Profinet to the plant SCADA for remote trim (S1, S3).
| Layer | Component | Spec / function | Typical range |
|---|---|---|---|
| Instrumentation | Streaming current detector | Floc charge endpoint | ±5 mV setpoint |
| Instrumentation | UV254 sensor | NOM / protein proxy | 0.05-0.3 cm⁻¹ |
| Instrumentation | Magmeter | Flow signal | ±0.5% accuracy |
| Controller | PLC + HMI | PID + feed-forward, recipe storage | Modbus TCP / Profinet |
| Metering pump | Hydraulic diaphragm | Alum, PAC, ferric chloride | 0.5-50 L/h, ±1%, 100:1 turndown |
| Metering pump | Peristaltic | Polymer (shear-sensitive) | 0.1-10 L/h |
| Skid | 316L SS frame | Pre-wired, factory-tested, NEMA 4X panel | Double-contained tubing, leak detection |
| Injection | Static mixer | 6-12 elements, coagulant + polymer separate | 1-2 pipe diameters upstream of DAF |
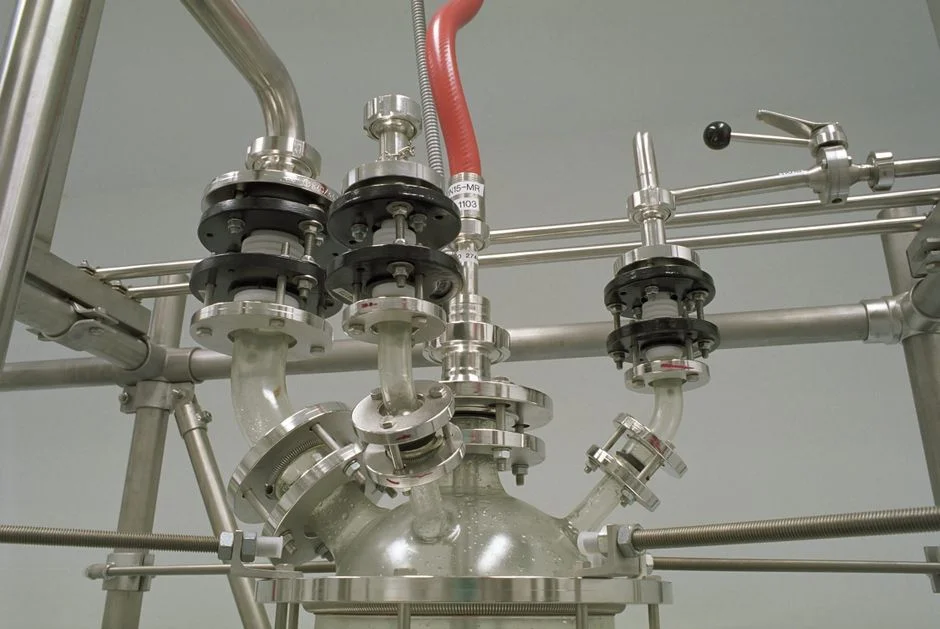
Metering pumps must be matched to chemical: hydraulic or solenoid diaphragm pumps handle alum, PAC, and ferric chloride with 100:1 turndown and ±1% accuracy across 0.5-50 L/h; peristaltic pumps are mandatory for polymer because they impose almost no shear on the activated flocculant (0.1-10 L/h range). The skid itself should ship on a 316L stainless frame with double-contained tubing, calibration columns, pressure relief, leak detection, and a NEMA 4X panel, pre-wired and factory acceptance-tested — see a typical PLC-controlled coagulant dosing skid for food wastewater for the integrated reference design. At the injection point, a 6-12 element static mixer or a hydraulic jump at the DAF inlet ensures flash mixing within 1-2 pipe diameters, and coagulant plus polymer must be injected at separate points to avoid charge neutralization of the polymer chain.
Control Strategy Comparison: Matching Algorithm to Food Plant Reality
Selecting the right control philosophy matters more than pump brand or PLC platform — the wrong strategy simply cannot react fast enough to food-plant transients. Empirical data shows that correlation between predicted and actual optimum dose climbs from 0.58 (flow + effluent turbidity only) to over 0.90 when multiple influent parameters feed the model in real time (S1, 1994). That gap is the entire chemical-savings opportunity, and it maps directly to control architecture.
| Strategy | Inputs | Correlation to optimum dose | Best-fit application | Limitations |
|---|---|---|---|---|
| 1. Flow-paced only | Magmeter | 0.58 (S1) | Steady continuous beverage line | Fails during CIP, product changeover |
| 2. Feed-forward (flow + pH + conductivity) | 3 sensors | 0.70-0.75 | Gradual load shifts, dairy | Misses CIP chemistry spikes |
| 3. Feed-forward (schedule + flow) | DCS tags for CIP/product changeover + flow | 0.80-0.85 | Plants with mature DCS, IT/OT integration | Requires historian and tag mapping |
| 4. Hybrid (feed-forward + SCD/UV254 trim) | Strategy 3 + SCD + UV254 | 0.90+ (S1) | Multi-product meat, produce, dairy | Higher CAPEX; trim rate must be capped |
| 5. ANN/RNN predictive | Historical pH, hardness, TSS, Cl⁻ (S3) | Variable, model-dependent | Plants with 6+ months data and analytics team | Needs feature engineering; unstable for coagulant aids (S3) |
For most multi-product food plants, Strategy 4 is the practical optimum: the feed-forward block handles the predictable daily load trajectory (CIP start, product changeover, shift change) while the SCD and UV254 trim the residual error within ±20% of the feed-forward setpoint. Tuning rules: start with a jar test dose vs. SCD setpoint curve to establish the endpoint, set feed-forward gain from a 3-day mass balance during a representative production week, and cap feedback trim rate at 5%/min to prevent oscillation around the endpoint. Strategy 5 (ANN/RNN) is technically promising but unstable in validation for coagulant aids in published studies (S3, Springer, 2025-08), so treat it as a 2-3 year horizon item rather than a 2026 procurement decision.
Coagulant Selection & Dosing Parameters for Food Wastewater Streams
Chemical selection is driven by colloid charge, pH window, and downstream disposal constraints, not by generic "best coagulant" lists. Published treatability data for food processing effluent shows 60% COD reduction at 200 mg/L alum dose, and confirms that cationic polyelectrolyte (Oxyfloc FL-11) hits its optimum at 0.4 mg/L while nonionic Zetag 7650 works best at 0.3-0.6 mg/L with 200-300 mg/L lime (S5, IJCPS, 2013). Those numbers translate into per-sector starting recipes below.
| Sector | Primary coagulant | Dose (mg/L) | Polymer type & dose | Target removal |
|---|---|---|---|---|
| Meat / poultry | Ferric chloride 80-150 or PAC 50-100 (as Al₂O₃) | 80-150 | Cationic, 0.5-2 mg/L | 85% TSS, 65% COD |
| Dairy | Alum 100-200 or PAC 60-120; lime 200-300 if P removal needed | 100-200 | Anionic, 0.3-1 mg/L | 60% COD at 200 mg/L alum (S5) |
| Produce / canning | PAC 40-80 | 40-80 | Nonionic, 0.2-0.5 mg/L | Low dose, high variability |
| Beverage / brewery | Often skipped; PAC 20-50 if P-limited | 20-50 | Rarely required | BOD reduction via biology |
Polymer charge selection is non-negotiable: cationic for high-protein, negatively charged colloids (meat, dairy); anionic for starch and sugar streams (produce); nonionic for mixed colloidal loads. Every recipe must be confirmed by jar testing with actual plant water under peak and average load — published doses are starting points, not setpoints. Standardize the jar test procedure: six 1 L beakers, 100-200 rpm rapid mix for 1 minute, 30-50 rpm slow mix for 15-20 minutes, 30 minutes settling, then measure supernatant COD, TSS, and turbidity.
Integration with DAF and Lamella Clarifier: The Overlooked Performance Lever

Dose and downstream separation are not independent — they are a coupled control loop, and most dosing skid vendors ignore the coupling. In a DAF, coagulant dose sets floc size and density, which in turn sets the air-to-solids ratio, float thickness, and polymer demand. Overdose produces pinpoint floc and a watery, low-solids float; underdose produces no floc and solids carryover that breaks effluent TSS. In a lamella clarifier, dose drives floc settling velocity; target surface loading is 20-40 m/h, and overdose inflates sludge volume by 30%+ (S1, 1994).
Integration is straightforward once the coupling is acknowledged. The dosing PLC shares the SCD setpoint with the DAF recycle pump VFD so that dissolved-air pressure tracks floc charge; the polymer injection point sits 1-2 pipe diameters downstream of coagulant injection with its own static mixer, and the dose ratio (coagulant:polymer) typically runs 100:1 to 50:1 by weight. Finally, the DAF float or clarifier underflow solids concentration (target 3-5% TS) feeds back to the polymer trim loop — thin sludge means increase polymer, thick sludge means back off. Pairing the dosing skid with a properly matched DAF for coagulated food processing wastewater is the most common path to sub-100 mg/L TSS on meat and dairy streams. A side-by-side selection methodology for DAF versus lamella is covered in our DAF vs lamella clarifier selection methodology guide, which applies the same settling-velocity framework to food streams.
Equipment Selection Matrix: Sizing, Specs & Vendor Evaluation Checklist
Pump sizing follows one rule: maximum dose (mg/L) × peak flow (m³/h) ÷ 1000 = kg/h, then convert to L/h using solution density (e.g., 10% alum ≈ 1.1 kg/L), and add a 30% safety factor. Storage should hold 14-30 days of supply: a 10% alum bulk tank of 5,000-20,000 gal is typical for a mid-sized plant, PAC ships as 10-18% solution, and 40% ferric chloride requires a heated, insulated tank in any climate that sees winter. Polymer make-down is the most failure-prone subsystem — use an automatic powder feeder or liquid dilution to 0.1-0.5% active, age 30-60 minutes in a low-shear tank, and pump with a peristaltic or progressive cavity unit only.
| Parameter | Specification / rule | Typical value |
|---|---|---|
| Pump sizing formula | Dose × peak flow × 1.3 safety factor | kg/h → L/h via solution density |
| Coagulant storage | 14-30 day supply, bulk tank | 5,000-20,000 gal (10% alum) |
| Ferric chloride tank | 40% solution, heated & insulated in cold climates | — |
| Polymer make-down | 0.1-0.5% active, 30-60 min aging | Peristaltic or PC pump only |
| Wetted parts certification | NSF/ANSI 61 | Required for food-contact |
| Panel certification | UL 508A | — |
| CAPEX range | Skid (single coagulant + polymer, ~50 m³/h) | $45K-120K |
| OPEX — chemical | Per m³ treated | $0.05-0.15 |
| OPEX — power | Per m³ treated | <$0.01 |
| OPEX — maintenance | % of CAPEX per year | ~2% |
Use the checklist below to filter vendor proposals before requesting a quote: NSF/ANSI 61 wetted parts, UL 508A panel build, remote access via VPN for OEM support, 24/7 technical support contract, included spare parts kit, and a documented factory acceptance test (FAT) protocol. CAPEX for a complete skid (single coagulant + polymer, ~50 m³/h capacity) lands in the $45K-120K range; OPEX breaks down to chemical $0.05-0.15 per m³ treated, power under $0.01/m³, and maintenance around 2% of CAPEX per year. The reference design for this class of skid is our PLC-controlled coagulant dosing skid for food wastewater.
Compliance, Reporting & ROI: Building the Business Case

An automated dosing system with data historian is a compliance asset as much as a process asset: it produces a continuous record that closes the manual-log gaps that trigger EPA inspections under EPA 40 CFR 432/405 pretreatment limits for food plants. Alarms on dose exceeding 150% of setpoint provide early upset detection, and monthly DMR/CSV exports go straight to EPA NetDMR or the local POTW without manual transcription.
The financial case is unusually clean. Hybrid control cuts coagulant use 20-35% versus flow-paced dosing (the 0.58→0.90 correlation gap from S1), and DAF-integrated polymer trim saves another 15-25%. On a typical mid-sized food plant paying $150K-500K/yr in BOD/TSS surcharges, 20% coagulant optimization combined with 10% better removal yields $30K-100K/yr in surcharge avoidance. Optimal dose also minimizes sludge volume — 30% less haul-off at $50-150/ton is a real line item. Worked example: $85K system, $60K/yr combined savings (chemical + surcharge + sludge), 1.4-year payback, 5-year NPV at 8% discount of roughly $180K. That is the figure to put in front of plant management, and it holds up against any reasonable sensitivity on chemical price or surcharge rate.
Frequently Asked Questions
What control strategy is best for a multi-product food plant with daily CIP?
Hybrid feed-forward plus SCD/UV254 feedback trim (Strategy 4) — correlation to optimum dose above 0.90 versus 0.58 for flow-paced only (S1, 1994). Feed-forward handles scheduled CIP and product changeover; feedback trims residual error within ±20% of setpoint.
How do I size a metering pump for a coagulant dosing system?
Maximum dose (mg/L) × peak flow (m³/h) ÷ 1000 = kg/h, then convert to L/h using solution density (e.g., 10% alum ≈ 1.1 kg/L), and add a 30% safety factor. Specify 100:1 turndown and ±1% accuracy for hydraulic diaphragm pumps on coagulants.
Which polymer charge works best for meat and dairy wastewater?
Cationic polymers for high-protein, negatively charged colloids (meat, dairy) at 0.5-2 mg/L; anionic for starch/sugar streams (produce) at 0.3-1 mg/L; nonionic for mixed loads at 0.2-0.5 mg/L. Always confirm with jar tests using actual plant water under peak load (S5, 2013).
How does the dosing system coordinate with a DAF?
The dosing PLC shares the SCD setpoint with the DAF recycle pump VFD, and the DAF float solids concentration (target 3-5% TS) feeds back to the polymer trim loop. Polymer injection sits 1-2 pipe diameters downstream of coagulant injection with its own static mixer.
What documentation does an automated dosing system generate for compliance?
Continuous trend logs of dose, flow, SCD, and pH; automated monthly DMR/CSV exports for EPA NetDMR or POTW submission; and alarms on dose exceeding 150% of setpoint for early upset detection — closing the manual-log gaps that drive EPA inspection triggers under 40 CFR 432/405.