An MBR wastewater treatment system pairs biology with 0.1 μm ultrafiltration membranes and removes 95%+ of solids and pathogens without secondary clarifiers. The membrane bioreactor cost per m3 runs $0.15–$0.30 treated and $500–$1,200 per m³/day installed in 2025.
Unlike conventional activated sludge trains, MBR eliminates secondary clarifiers, cutting footprint by up to 60% and delivering near-reuse-quality effluent. Those economics fit space-constrained sites and projects that need strict discharge or reuse water, such as semiconductor fabs and hospitals. Membrane separation replaces settling as the solids barrier, which keeps effluent stable even when sludge settleability drops.
Membrane Bioreactor Cost per m3: What the 2025 Bands Mean
The membrane bioreactor cost per m3 treated is $0.15–$0.30 in 2025 operating cost, and capital cost is $500–$1,200 per m³/day. A 0.1 μm membrane removes 95%+ of TSS and BOD without a secondary clarifier. Engineers pick MBR when land must fall by up to 60% or reuse needs turbidity under 1 NTU.
Buyers mix two units and then argue past each other. CAPEX here is dollars per m³/day of capacity, not dollars per m³ treated. OPEX is dollars per m³ treated and already folds energy, membrane replacement, labor, and chemicals. Most plants we size between 10 and 2,000 m³/day land inside the $500–$1,200 per m³/day band before unusual civil works.
Why Factories and Municipalities Switch to Membrane Bioreactors
Membrane bioreactors couple biology with 0.1 μm-class ultrafiltration and remove 95%+ of TSS and BOD under design load. They shrink plant footprint by up to 60% versus clarifier-based trains. CAPEX in 2025 sits at $500–$1,200 per m³/day. Effluent often reaches <1 NTU and <10 mg/L BOD, which supports reuse and Class 1A-style discharge limits.
Urban factories and municipalities adopt the technology when land is scarce or reuse targets apply. The global MBR market was projected to exceed $4 billion by 2025. That outlook assumed a compound annual growth rate (CAGR) of 9.8% from 2020. Drivers include water scarcity and rules such as China’s GB 18918-2002 Class 1A and the EU Urban Waste Water Directive 91/271/EEC.
Earlier guidance used a 9.8% CAGR from 2020 and a market above $4 billion by 2025. According to BCC Research (August 2025), the estimate is now $4.4 billion in 2025. That figure reaches $9.4 billion by the end of 2030 at a 16.1% CAGR from 2025 to 2030. Asia-Pacific holds the largest share in that report, while membrane fouling remains a named restraint.
Most plants we size for industrial parks start near the lower MLSS band until membranes stabilize. Operators then raise biomass once TMP trends stay steady. Footprint cuts near 40% versus a clarifier-based activated sludge train appear often when clarifiers and sand filters are removed. Rising municipal water prices turn the compact layout into a procurement decision, not only a process preference.
US EPA publishes a Membrane Bioreactors wastewater management fact sheet as its public overview of MBR applicability at treatment plants. Design bands on this page stay with the ranges in the tables below, not with unnamed brochure claims. Most plants we commission still start below nameplate flux.
How MBR Wastewater Treatment Works: Step-by-Step Process Flow
Membrane bioreactor trains integrate biological degradation with physical membrane separation in one compact flowsheet. Each stage either protects membranes or raises removal. Setpoints differ for municipal versus industrial loads, and the table below keeps the design bands used on this page.
Field teams often hold municipal flux near 15–20 LMH during commissioning, then step toward 25 LMH only after TMP and permeability stabilize for several weeks. Industrial MBR wastewater duties with oils or dyes usually stay closer to 10–15 LMH. Those operating choices protect membranes better than chasing nameplate flux on day one.
Pre-treatment: Raw wastewater first undergoes screening to remove large solids and protect membranes from fouling and damage. Mechanical screening, such as HydropureWater’s GX Series rotary mechanical bar screens for MBR pre-treatment, can remove over 95% of total suspended solids (TSS) larger than 2-3 mm. That step cuts maintenance hours. It also extends membrane life when grit and fibers are present in the feed.
Biological Treatment: After screening, wastewater enters a biological reactor with anoxic and aerobic zones. Activated sludge microorganisms degrade organic matter (BOD/COD) and nutrients (nitrogen, phosphorus). Typical mixed liquor suspended solids (MLSS) in an MBR tank ranges from 8,000–12,000 mg/L. That band sits well above the 2,000–4,000 mg/L range in conventional activated sludge.
High MLSS supports sludge retention times (SRT) of 15–30 days and hydraulic retention times (HRT) of 6–12 hours. Those retention times shrink tank volume for the same organic load. Most plants we size for municipal parks hold the lower end of that MLSS band until scour air and TMP look steady.
Membrane Filtration: Submerged ultrafiltration (UF) membranes, typically PVDF (polyvinylidene fluoride) with a pore size of 0.1 μm, sit in the biological tank. A slight vacuum or pressure draws permeate through the pores. Membranes retain biomass, suspended solids, bacteria, and viruses at the same time. Municipal flux often runs 15–25 LMH (liters/m²/hour).
Industrial duty with higher fouling potential usually holds 10–20 LMH. Regular permeate backflushing and chemical cleaning (for example sodium hypochlorite or citric acid) keep flux stable as TMP rises.
Post-treatment: When reuse or sensitive receiving waters demand another barrier, plants add disinfection or polishing. Options include chlorine dioxide generators for MBR effluent disinfection, UV irradiation, or activated carbon filters. The choice depends on pathogen targets and downstream RO or cooling-tower limits.
Sludge Handling: Excess activated sludge leaves the reactor on a controlled wasting schedule. The concentrated sludge often dewaters on equipment such as plate and frame filter presses to 20–30% solids. Higher cake solids lower haul-away volume and disposal cost versus dilute conventional waste sludge.
| MBR Process Parameter | Typical Range (Municipal) | Typical Range (Industrial) | Purpose/Impact |
|---|---|---|---|
| Membrane Pore Size | 0.03 - 0.1 μm (UF) | 0.03 - 0.1 μm (UF) | Separates solids, bacteria, viruses; defines effluent quality |
| Membrane Material | PVDF, PES, PS | PVDF, PES, PS | Chemical resistance, mechanical strength, fouling resistance |
| MLSS Concentration | 8,000 - 12,000 mg/L | 10,000 - 15,000 mg/L | High biomass concentration for efficient degradation |
| Hydraulic Retention Time (HRT) | 6 - 12 hours | 8 - 16 hours | Time for biological reactions to occur |
| Sludge Retention Time (SRT) | 15 - 30 days | 20 - 40 days | Ensures robust microbial population for degradation |
| Membrane Flux Rate | 15 - 25 LMH | 10 - 20 LMH | Volume of permeate produced per unit membrane area per hour |
| Transmembrane Pressure (TMP) | 0.05 - 0.5 bar | 0.1 - 0.8 bar | Pressure difference driving filtration; indicator of fouling |
MBR vs. Conventional Systems: Efficiency, Cost, and Application Suitability
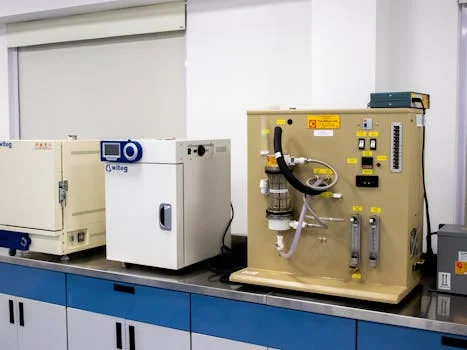
MBR systems outperform conventional trains on effluent quality and footprint, with a different energy and cost profile. MBR achieves 95%+ removal of TSS and BOD. That sits above the 85–90% band typical for conventional activated sludge (CAS) or sequencing batch reactor (SBR) systems. Dissolved air flotation (DAF) reaches about 90% when the duty is mainly fats, oils, and grease (FOG) or suspended solids (per EPA 2024 benchmarks).
MBR permeate often sits below 1 NTU turbidity and below 10 mg/L BOD. Those numbers align with strict limits such as China’s Class 1A. SBR effluent more often lands at 10–30 mg/L BOD and needs polishing before reuse.
What drives industrial mbr system footprint reduction?
Industrial MBR footprint falls by up to 60% versus CAS at the same design flow because clarifiers and many sand filters leave the plot. High MLSS and membrane solids separation drive that reduction, not a softer claim about compact equipment.
Space savings matter on constrained plots. Removing secondary clarifiers and often tertiary filters lets MBR use up to 60% less land than a CAS layout at the same design flow. High MLSS and membrane solids separation drive that reduction. The saving is a hydraulic and solids-separation result, not a soft claim about compactness.
Most plants we size on tight industrial pads see footprint cuts near 40% once the clarifier and the sand filter both leave the layout. The full 60% case needs the whole secondary and tertiary hall to disappear, and only a site survey can lock that number.
How does mbr vs sbr cost and efficiency differ?
On mbr vs sbr cost and efficiency, MBR reaches under 10 mg/L BOD and under 5 mg/L TSS, while SBR often sits at 10-30 mg/L for both before polishing. Energy still favors SBR on many municipal strengths.
Energy use is the main trade-off on many sites. MBR typically draws 0.6–1.2 kWh/m³ for biology aeration, membrane scour, and permeate pumping. Many SBR plants sit near 0.3–0.5 kWh/m³ on similar municipal strengths. CAPEX in 2025 sits near $500–$1,200 per m³/day for MBR against $300–$800 for SBR.
OPEX for MBR is about $0.15–$0.30 per m³ for energy, membrane replacement, and cleaning chemicals. SBR OPEX is often $0.10–$0.20 per m³. Those 2025 figures follow the cost bands retained in the comparison table below.
DAF remains a pretreatment tool, not a full secondary replacement, when soluble BOD dominates. MBBR can upgrade existing aeration tanks with carriers, yet still needs solids separation downstream. MBR collapses that solids step into the membrane barrier. That is why retrofit studies often compare clarifier-plus-filter plots against a single membrane tank hall on the same pad.
| Feature | MBR | SBR (Sequencing Batch Reactor) | DAF (Dissolved Air Flotation) | MBBR (Moving Bed Biofilm Reactor) |
|---|---|---|---|---|
| Effluent Quality (BOD/TSS) | <10 mg/L / <5 mg/L (Near Reuse) | 10-30 mg/L / 10-30 mg/L | 20-50 mg/L / 10-20 mg/L (Pre-treatment) | 15-40 mg/L / 15-40 mg/L |
| Footprint Reduction | Up to 60% vs. CAS | 20-40% vs. CAS | Compact for pre-treatment | Similar to CAS, but smaller biological reactor |
| Energy Consumption (kWh/m³) | 0.6 - 1.2 | 0.3 - 0.5 | 0.1 - 0.3 | 0.4 - 0.7 |
| CAPEX (2025, $/m³/day) | $500 - $1,200 | $300 - $800 | $200 - $600 (for pre-treatment) | $400 - $1,000 |
| OPEX (2025, $/m³) | $0.15 - $0.30 | $0.10 - $0.20 | $0.05 - $0.15 | $0.12 - $0.25 |
| Key Application | High-quality discharge, water reuse, space-constrained sites | Medium-scale treatment, fluctuating flows, nutrient removal | FOG removal, suspended solids, pre-treatment for high-strength | Upgrade existing plants, carbon/nitrogen removal, robust |
| Maintenance Complexity | Moderate (membrane cleaning) | Low to Moderate | Low to Moderate | Low |
What is the mbr wastewater treatment system price?
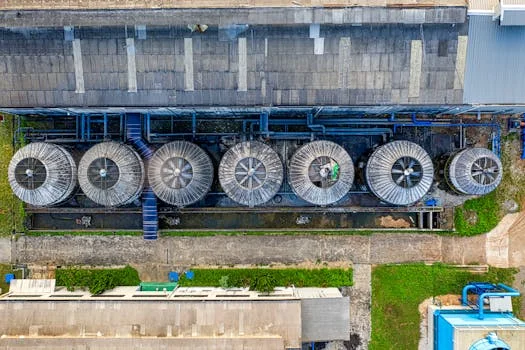
The mbr wastewater treatment system price in 2025 is $500–$1,200 per m³/day of installed capacity and $0.15–$0.30 per m³ treated. Membrane area, automation, and civil scope move a bid inside that band. Module price is a separate line and should not be added twice.
MBR capital spending in 2025 ranges from $500–$1,200 per m³/day of treatment capacity. Drivers include the capacity band (about 10–2,000 m³/day), membrane format (flat sheet versus hollow fiber), and automation depth. Membrane modules alone run about $200–$400/m² of membrane area. Biological tanks, aeration, pumps, controls, and ancillaries fill the rest of the package price on most industrial bids.
Module geometry also moves installed cost. Hollow-fiber packs often win on packing density for large municipal basins. Flat-sheet cassettes can simplify individual module swap-outs in compact industrial containers. Either way, civil tanks, blowers, and controls still dominate the package once capacity exceeds a few hundred m³/day.
Bid comparisons should normalize membrane area, scour air rate, and spare-part lead times, not only the headline $/m³/day number. Most plants we price above a few hundred m³/day see tanks and blowers outweigh the membrane line.
How do buyers read an mbr capex opex comparison 2025?
An mbr capex opex comparison 2025 shows MBR at $500–$1,200 per m³/day and $0.15–$0.30 per m³, versus SBR at $300–$800 per m³/day and $0.10–$0.20 per m³. Read CAPEX as capacity price and OPEX as treated-volume price, or the gap looks larger than the duty justifies.
Operating cost in 2025 typically falls in $0.15–$0.30 per m³ treated. Energy often accounts for $0.05–$0.10/m³ for aeration and pumping. Membrane replacement adds roughly $0.03–$0.07/m³ over a 5–10 year life. Labor ($0.02–$0.05/m³) and chemical cleaning ($0.01–$0.03/m³) complete the usual OPEX stack.
Those splits match the cost table retained below for buyer-side checks. Local power tariffs move the energy slice faster than chemical price does.
Return on investment comes from reuse credit, sludge volume reduction, and avoided non-compliance fines. Recycled water value of $0.50–$2.00/m³ matters in scarcity regions. Lower sludge mass can save about $0.10–$0.30/m³ versus dilute conventional wasting. Annual fine exposure of $10,000–$50,000 or more for serious violations remains a cash risk on audited sites.
For a 1,000 m³/day industrial case, payback often lands in 3–7 years when reuse and compliance credits are counted. Conventional trains without reuse more often need 5–10 years under the same tariff assumptions.
| Cost Category | MBR Cost (2025) | Factors Affecting Cost |
|---|---|---|
| CAPEX ($/m³/day capacity) | $500 - $1,200 | System capacity (10-2,000 m³/day), membrane type (PVDF hollow fiber/flat sheet), automation level, site-specific civil works |
| Membrane Modules | $200 - $400 per m² | Membrane material, manufacturer, module configuration |
| Biological Tanks & Equipment | $150 - $400 per m³/day | Tank material (steel/concrete), aeration system, mixing equipment |
| Pumps & Controls | $100 - $250 per m³/day | Permeate pumps, recirculation pumps, SCADA system, instrumentation |
| OPEX ($/m³ treated) | $0.15 - $0.30 | Energy prices, influent characteristics, membrane lifespan, labor rates |
| Energy Consumption | $0.05 - $0.10 | Aeration intensity, pumping requirements, local electricity rates |
| Membrane Replacement | $0.03 - $0.07 | Membrane lifespan (5-10 years), replacement cost, system design |
| Labor & Maintenance | $0.02 - $0.05 | Operator skill level, automation, preventive maintenance schedule |
| Chemical Cleaning | $0.01 - $0.03 | Fouling potential of influent, cleaning frequency, chemical costs |
| Sludge Disposal | $0.01 - $0.05 | Sludge volume, dewatering efficiency, local disposal fees |
Where does a membrane bioreactor reuse water application fit?
A membrane bioreactor reuse water application fits when the site needs turbidity under 1 NTU and BOD under 10 mg/L for cooling, process makeup, or RO feed. The membrane is the solids barrier. Disinfection or carbon still depends on the pathogen and organic target downstream.
According to US EPA (Cashman et al., EPA/600/R-16/243, 2016), recycled water from decentralized MBR scenarios avoids 0.94 to 0.96 cubic meters of drinking water per cubic meter of wastewater treated. Net energy benefits, once displaced drinking water is counted, start at the 1 MGD scale for aerobic MBR. They start at the 5 MGD scale for anaerobic MBR run at 35°C.
A psychrophilic anaerobic MBR at 20°C showed net energy benefits at every scale studied, from 0.05 MGD to 10 MGD. Anaerobic MBR cost stayed above aerobic MBR in every scenario in that study, mainly from extra labor. Energy demand per cubic meter fell as scale rose, which matches what most plants we size above a few hundred m³/day see on power bills.
What do MBR and RO units cost together?
Combined MBR and RO budgets start from MBR CAPEX of $500–$1,200 per m³/day, then add RO skids sized on permeate recovery for the ZLD or reuse target. OPEX adds MBR energy at 0.6–1.2 kWh/m³ plus RO feed-pressure power, which rises with salinity and recovery. Plan MBR membrane replacement every 5–10 years and RO elements on their own cycle. Use recycled-water value of $0.50–$2.00/m³ when you build payback.
Hybrid trains often win on tough industrial feeds. DAF ahead of MBR protects membranes when FOG spikes. For zero-liquid-discharge (ZLD) goals, MBR is a strong RO pre-treatment stage because low turbidity permeate raises RO recovery. See hybrid MBR-RO systems for zero-liquid-discharge (ZLD) projects for specs and cost bands.
Review MBR applications in semiconductor wastewater treatment for CMP-specific flowsheets and equipment notes. Most fabs we review still want a second barrier after the membrane before the water returns to a tool loop.
When to Choose MBR: Decision Framework for Engineers and Procurement Teams
MBR is the right pick when land is limited, reuse quality is mandatory, or discharge limits sit near <10 mg/L BOD with low turbidity. Urban industrial parks, retrofit basements, and remote pads with expensive land acquisition fit that profile. A 500 m³/day MBR Membrane Bioreactor Wastewater Treatment System with submerged PVDF membranes in a semiconductor fab duty achieved 99.8% contaminant removal and supported 90% water reuse in the project data retained for this guide.
Regional cost and compliance notes for similar trains appear in the MBR Wastewater Treatment System in New Zealand: Cost, Tech & Complianc. The MBR Wastewater Treatment System in UK: 2026 Engineering Guide with Cos covers engineering cost and ROI for the same process family.
Procurement teams should skip MBR when CAPEX must stay minimal. A 1,000 m³/day MBR package can exceed $1M before civil works. If influent FOG stays high, as in many food plants, install a DAF system for high-FOG wastewater pre-treatment first so membranes do not blind. Thin operator coverage for membrane cleaning and TMP control is another reason to favor simpler SBR or MBBR layouts on remote sites.
How should teams compare MBR capital cost to SBR?
MBR capital cost in 2025 typically runs $500–$1,200 per m³/day, while SBR packages often land at $300–$800 per m³/day before tertiary filters. Add polishing filters to SBR when reuse needs <1 NTU, and the gap narrows. Energy still favors SBR at about 0.3–0.5 kWh/m³ versus 0.6–1.2 kWh/m³ for MBR. Choose on footprint and effluent risk, not CAPEX alone.
Who Should Specify MBR—and Who Should Look Elsewhere
Plant engineers, EPC process leads, and procurement managers should use the MBR comparison against SBR, DAF, and MBBR when footprint, effluent quality, and life-cycle cost share the bid sheet. Look elsewhere if your duty is only FOG skim, if land is cheap and discharge limits are modest, or if no staff can run membrane cleaning.
Work this selection checklist before you freeze the process. Confirm peak flow and COD load. Measure FOG and grit. Set reuse or Class 1A targets.
Price energy at local tariffs. Plan membrane replacement at year 5–10. Verify operator coverage for TMP and CIP. Align civil footprint with the 60% space-saving case only after a site survey.
Send influent data and reuse targets for a sized package through request an MBR system quote so CAPEX and OPEX can be pinned to your m³/day duty before tender drawings lock.
Frequently Asked Questions
What is the typical lifespan of MBR membranes?
MBR membranes typically last 5 to 10 years when pre-treatment, flux, and chemical cleaning stay inside design limits. Aggressive FOG, grit, or skipped CIP cycles shorten that window. Stable TMP trends and scheduled sodium hypochlorite or acid cleans usually keep hollow-fiber or flat-sheet modules in the upper half of the range. Replacement cost in OPEX models often sits near $0.03–$0.07 per m³ averaged over membrane life.
How does MBR handle fluctuating wastewater flows?
MBR trains buffer flow swings through high MLSS (often 8,000–12,000 mg/L municipal) and a physical membrane barrier that holds solids regardless of settler performance. Shock organic loads dilute into a large biomass inventory, so BOD breakthrough is less common than in low-MLSS clarifier plants. Permeate quality still depends on keeping flux and TMP inside the design envelope during peaks. Equalization upstream remains good practice when diurnal peaks exceed membrane hydraulic capacity.
Is MBR suitable for high-strength industrial wastewater?
Yes—MBR suits high-strength industrial wastewater because long SRT (15–40 days by duty) and high MLSS support slow degraders. Complex organics need adequate HRT (often 8–16 hours industrial) and reliable oxygen transfer. Very high FOG or solvents still need upstream DAF or specialized pretreatment so membranes do not foul. Pairing MBR with RO is common when the site needs reuse or ZLD-quality feed water.
What are the main maintenance requirements for an MBR system?
Core maintenance is membrane health: permeate backflush, periodic chemical cleans, and TMP trending to catch fouling early. Screens, grit traps, and sludge wasting equipment need routine inspection so fibers and solids never reach the modules. Compared with clarifier plants, operators spend less time on settler blankets and more time on CIP chemistry and aeration scour. Spare permeate pumps and a documented cleaning SOP cut downtime when TMP rises suddenly.
When should engineers choose MBR over SBR for reuse projects?
Choose MBR over SBR when reuse needs turbidity near <1 NTU and BOD often <10 mg/L without a large tertiary filter hall. SBR can meet moderate discharge limits at lower energy (about 0.3–0.5 kWh/m³ versus 0.6–1.2 kWh/m³ for MBR) but usually needs extra polishing for RO feed. Tight plots favor MBR’s up-to-60% footprint cut versus CAS-style layouts. If budget is the binding constraint and land is available, SBR plus filters may still win on CAPEX.