Why Surabaya data centers cannot afford to ignore blowdown recovery
A Surabaya data center carries a contradiction that derails generic tropical-water templates: the city receives 1,500-2,000 mm of annual rainfall yet PDAM Surya Sembada intake TDS climbs from 80-150 mg/L in the wet season to 250-400 mg/L in the June-October dry window, when reservoir levels drop and industrial users absorb the shortfall. At the same time, conventional evaporative cooling systems lose 20-40% of their intake water as blowdown (per Genesis Water Technologies, 2025), and an efficient facility still reports a Water Usage Effectiveness (WUE) of 0.47-0.65 Gal/kWh (1.8-2.5 L/kWh) because the metric does not distinguish consumed water from returned water. For a 100 MW hyperscale benchmark of 2 million L/day, that is roughly the daily use of thousands of households (per IDE Water Technology, 2026); a realistic 5-20 MW Surabaya colocation site sits between 50,000 and 400,000 L/day of total water demand depending on IT load and PUE. The compliance floor is layered: PP No. 22/2021 sets the wastewater-management permit framework, and Permen LHK No. 5/2014 sets the industrial effluent quality standards, including pH 6-9 and TSS ≤200 mg/L for cooling-tower blowdown routed to surface water. Blowdown recovery in Surabaya is therefore a license-to-operate issue, not a sustainability nice-to-have.
Cooling tower blowdown chemistry in a 28-32°C Surabaya climate
Cooling tower blowdown (CTBD) is the concentrated purge stream that protects an evaporative cooling loop from mineral saturation. Its volume is governed by a simple relationship: blowdown ratio equals 1/(CoC-1) of makeup, which works out to 33% at 4 cycles of concentration (CoC), 20% at 6 CoC, and only a 5-percentage-point improvement from the 4 to 6 step, a 20% reduction in blowdown volume, not the 50% most operators assume (per Genesis Water Technologies, 2025). In a Surabaya cooling loop at 4-6 CoC, total dissolved solids in the bleed typically reach 1,500-3,000 mg/L, silica climbs to 50-150 mg/L, and calcium hardness, chloride, and sulfate scale proportionally. The stream also carries residual biocides, phosphonates from scale-inhibitor programs, and suspended solids stripped from tower fill and basin, so the composition is essentially already-conditioned water, contaminated mainly by concentration, not by exotic pollutants. Surabaya's 28-32°C wet-bulb envelope raises evaporative load and accelerates every scaling reaction: warmer feed water shortens the induction phase before CaSO4 and CaCO3 precipitation and speeds silica polymerization, so any high-recovery design must use temperature-corrected saturation modeling rather than temperate-climate projection software. Biological fouling deserves equal weight, because Legionella and microbiologically influenced corrosion (MIC) both amplify in 28-32°C basin water with intermittent nutrient loading from makeup organics, which forces every Surabaya train to pair membrane separation with continuous microbiological control and a final disinfection barrier on the permeate side.
Baseline treatment train: lamella clarification → DAF → UF → BWRO
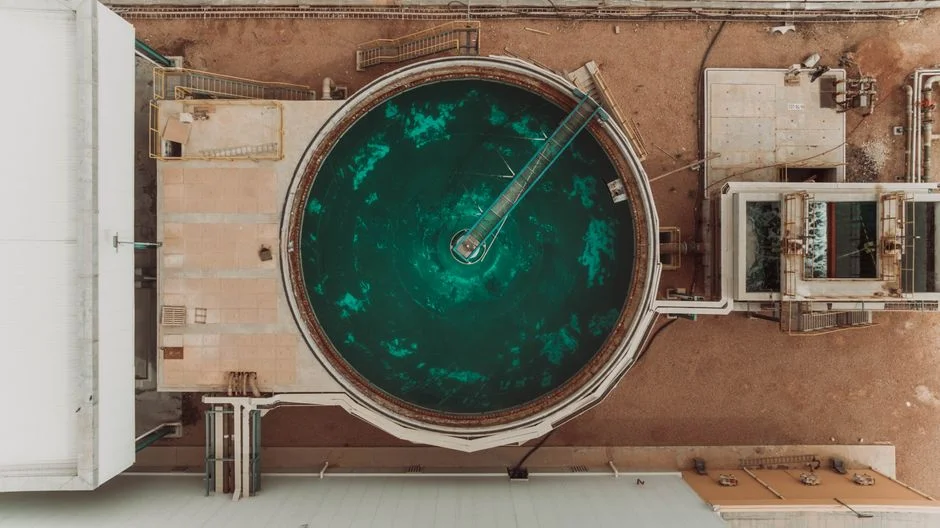
A modular Surabaya train starts with a high-efficiency lamella clarifier for primary TSS reduction operating at 20-40 m/h surface loading. Stage 2 is a dissolved air flotation system in the 4-300 m³/h capacity band, sized to strip oil, grease, and colloidal material ahead of the membrane train. Stage 3 is a 0.03 μm PVDF ultrafiltration system that drops the silt density index below 3 and tolerates up to 300 ppm feed turbidity, which is the SDI the downstream RO membranes need to stay on their 5-year replacement cycle. Stage 4 is an industrial brackish-water reverse osmosis system at conservative 70-75% local recovery targeting <50 mg/L permeate TDS, paired with a PLC-controlled antiscalant and biocide dosing skid sized to 4-8 L/h per chemical feed point. Right-sizing is the single most consequential engineering decision on a non-megawatt project: hyperscale water-reuse technology inflates capital costs per gallon treated 3-4× at 5 MW, and operational complexity exceeds what a two-shift O&M team can run (per Genesis Water Technologies, 2025). The modular 100-300 GPM framework below is the same one applied in the parallel Medan engineering guide, with Surabaya loading numbers substituted.
| IT load | Makeup demand (L/day, 1.0 L/kWh) | CTBD at 4 CoC (L/day) | Modular treatment train (GPM) |
|---|---|---|---|
| 5 MW | 120,000 | 40,000 | 25-50 |
| 10 MW | 240,000 | 80,000 | 75-100 |
| 15 MW | 360,000 | 120,000 | 100-150 |
| 20 MW | 480,000 | 160,000 | 150-250 |
Pushing recovery past 80%: the controlled-precipitation upgrade
Conventional brackish-water reverse osmosis plateaus at 75-80% recovery because silica, calcium carbonate, and calcium sulfate all reach saturation as the concentrate stream concentrates (per IDE Water Technology, 2026). Pushing past that ceiling with a traditional design means adding interstage boosting pumps, multi-pass layouts, and aggressive chemical dosing, which inflates both CAPEX and operational fragility on a site that only has two O&M staff per shift. A controlled-precipitation upgrade sidesteps that ceiling. The concentrate from a first-pass BWRO operating at conservative local recovery is routed to a fluidized bed reactor where scaling inhibitors are deactivated under controlled chemistry. Sparingly soluble salts, including silica, calcium carbonate, and calcium sulfate, precipitate as dense pellets on seed material and are withdrawn as a solid waste stream that feeds a plate-and-frame filter press for the fluidized-bed pellet stream. The remaining liquor is predominantly sodium chloride, which can be processed at much higher recovery without the same scaling risk. Overall system recovery lands at ~95%, with permeate silica around 1 mg/L (per IDE Water Technology, 2026). For a 20 MW Surabaya site, recovering 90% instead of dumping blowdown after a single RO pass cuts freshwater intake by roughly 6,000 m³/month and reduces PDAM Surya Sembada draw during the June-October dry season, when the utility itself is squeezed. RO and UF membrane replacements on the first-pass skid still need to be budgeted on the standard 3-5 year cycle.
Baseline vs. high-recovery: which train earns the Surabaya premium?
The procurement decision is not which technology is better in the abstract, but which train clears the ROI bar at the site's IT load. At 5 MW the baseline BWRO is the right answer, because CAPEX per gallon treated is high and the freshwater displacement is too small to amortize a fluidized-bed reactor. At 20 MW, and on any site where WUE is a board-level KPI, the controlled-precipitation upgrade earns the premium because every additional percentage point of recovery is multiplied by a much larger blowdown volume. The operational trade-off is real: the fluidized bed reactor adds a solid-waste stream (precipitated pellets) and one more unit to the SCADA, so it is a 10-20 MW-scale decision, not a 5 MW one. The published payback benchmark for a modular 10 MW scope is 3-5 years once total cost of water, including PDAM bulk potable rate, KLHK discharge fees, and community-relations risk, is included (per Genesis Water Technologies, 2025). The high-recovery option compresses that payback further by displacing more PDAM intake during the dry months.
| Parameter | Baseline lamella → DAF → UF → BWRO | Baseline + controlled-precipitation upgrade |
|---|---|---|
| Overall recovery | 75-80% | ~95% |
| Permeate TDS | <50 mg/L | <50 mg/L |
| Permeate silica | 5-15 mg/L (single-pass) | ~1 mg/L |
| Freshwater displaced at 20 MW | ~3,500 m³/month | ~6,000 m³/month |
| Added CAPEX vs. baseline | — | ~35-50% on top of BWRO skid |
| Added OPEX complexity | Antiscalant, biocide, membrane CIP | Plus pellet withdrawal, FBR SCADA, seed inventory |
| Best-fit IT load | 5-10 MW | 10-20 MW |
Right-sized CAPEX, OPEX, and payback for a 5-20 MW Surabaya site
Published benchmarks put a 15 MW modular blowdown treatment plant at roughly USD 200,000 in CAPEX, or about IDR 3.2 billion at a 2026 USD/IDR reference of 16,000 (per Genesis Water Technologies, 2025). The table below scales that modular scope across 5, 10, 15, and 20 MW, deliberately excluding the 3-4× hyperscale penalty that inflates per-gallon CAPEX at small scale, and adds a separate row for the controlled-precipitation fluidized-bed upgrade at 20 MW. Annual OPEX is dominated by antiscalant and biocide chemicals, RO membrane replacement on a 3-5 year cycle (IDR 90-130 million/yr amortized), filter press cloths, and Surabaya industrial electricity at IDR 1,100-1,400/kWh. Simple payback lands at 3.0-4.0 years for a 10 MW modular scope, compresses below 3 years at 20 MW, and lengthens past 4 years at 5 MW where OPEX dominates (per Genesis Water Technologies, 2025). This cost stack is consistent with the Jakarta and Bandung data center blowdown guides in the same family.
| IT load | Modular CAPEX (IDR) | Annual OPEX (IDR) | Simple payback |
|---|---|---|---|
| 5 MW | ~1.4 billion | ~280 million | 4.0+ years |
| 10 MW | ~2.3 billion | ~450 million | 3.0-4.0 years |
| 15 MW | ~3.2 billion | ~620 million | 3.0-3.5 years |
| 20 MW (baseline) | ~4.0 billion | ~780 million | <3.0 years |
| 20 MW + FBR upgrade | ~5.6-6.0 billion | ~950 million | 3.0-3.5 years (higher displacement) |
Five-stage implementation roadmap for a Surabaya colocation site
Most facilities stall between Stage 2 and Stage 3, having optimized existing operations but lacking a clear path to meaningful reuse, because the gap is strategic clarity about treatment objectives, technology selection, and operational integration (per Genesis Water Technologies, 2025). The sequence below is built so the O&M contractor and EPC can execute it without stalling at that handoff. Stage 1: install makeup, blowdown, evaporation, and water-quality monitoring, then identify the 15-30% gap between actual and theoretical blowdown that almost every site discovers once metering is honest. Stage 2: repair leaks, eliminate once-through cooling, and add self-cleaning filtration to reduce clarity-driven blowdown. Stage 3: simplify the chemical program (oxidizing biocide rotation or non-oxidizing, low-dissolved-solids alternatives) to enable higher CoC and cleaner blowdown. Stage 4: deploy the modular lamella → DAF → UF → BWRO train at 100-300 GPM total, tied to a PLC-controlled antiscalant and biocide dosing skid, and route permeate to non-critical reuse first. Stage 5: add the controlled-precipitation upgrade for blowdown-to-makeup reuse, closing the cooling loop on evaporative losses only.
KLHK compliance and the AMDAL/UKL-UPL paperwork chain
The permit chain is layered and the discharge permit is not a footnote; it is the document that lets the plant operate at all. PP No. 22/2021 sets the permitting and discharge framework, and Permen LHK No. 5/2014 sets the effluent quality standards, pH 6-9, TSS ≤200 mg/L, plus BOD/COD limits if the blowdown is blended with sanitary waste before final discharge. The AMDAL or UKL-UPL package includes the environmental management plan (RKL) and monitoring plan (RPL), which the EPC contractor normally bundles with the building permit submission. Two operational alarms are non-optional on a Surabaya site: a 24/7 cooling-tower basin level and conductivity alarm prevents emergency dumps that field data shows can inflate actual blowdown 15-30% above theoretical (per Genesis Water Technologies, 2025), and a BWRO concentrate-flow interlock prevents membrane over-recovery events during monsoon-driven feed variability. Both alarms feed the SCADA package and the O&M contractor's monthly compliance report. The same baseline lamella → DAF → UF → BWRO logic applies across the region, with the same modular approach used in the Jakarta data center blowdown guide and the Bandung sibling guide, with only local discharge limits and water-cost inputs swapped in.
Frequently Asked Questions
What cycles of concentration should a Surabaya data center target?
4-6 CoC is the operating window for a tropical Surabaya site. Below 4 CoC, freshwater consumption and PDAM Surya Sembada draw become uneconomic; above 6 CoC, silica, CaSO4, and microbiological fouling risk escalates faster than the modest 5-percentage-point blowdown reduction. The target narrows to 4-5 CoC in the June-October dry season when PDAM intake TDS rises to 250-400 mg/L.
What is the regulatory floor for cooling-tower blowdown discharge in Surabaya?
Permen LHK No. 5/2014 sets the industrial effluent quality standards at pH 6-9, TSS ≤200 mg/L for cooling-tower blowdown routed to surface water, and BOD/COD limits if the stream is blended with sanitary waste. PP No. 22/2021 governs the discharge permit and the AMDAL/UKL-UPL environmental management documentation the operator must file.
Why is ultrafiltration non-negotiable before BWRO on Surabaya blowdown?
RO membranes on CTBD feed require SDI below 3, achieved with lamella clarification, DAF, 5 μm cartridge filtration, and a 0.03 μm PVDF ultrafiltration stage. Without UF, the silt density index routinely exceeds 5 and the RO membrane replacement cycle shortens from 5 years to under 2 years, which destroys the OPEX case for the BWRO stage.
Do air-cooled chillers eliminate the blowdown problem?
No. Air-cooled chillers remove the evaporative loop but still carry adiabatic pre-cooling, humidification, and once-through heat-exchanger loads that produce concentrated wastewater. In a Surabaya 28-32°C ambient, hybrid systems with adiabatic pre-cooling continue to generate a smaller blowdown stream, and the same KLHK discharge compliance still applies.
What is the payback band for a modular blowdown treatment train?
3.0-4.0 years simple payback for a modular 10 MW scope once total cost of water is included, compressing below 3 years at 20 MW and lengthening past 4 years at 5 MW (per Genesis Water Technologies, 2025). The high-recovery upgrade compresses payback further by displacing more PDAM intake during the dry season.
Related Equipment
- industrial brackish-water reverse osmosis system — specifications, capacity range, and technical data