Why Petroleum Wastewater in Pompano Beach Is Not a Generic Activated Sludge Feed
Petroleum terminal and re-refining wastewater in Pompano Beach routinely carries 100-500 mg/L free oil and grease, 50-300 mg/L emulsified hydrocarbons, 5-50 mg/L BTEX (benzene, toluene, ethylbenzene, xylene), 1-20 mg/L phenols, 10-80 mg/L sulfide, and chloride from 250 mg/L (background) up to 3,000-6,000 mg/L during seawater intrusion or ballast discharge events. Flows swing 2-4× between day and night, and slug loads of 5-10× baseline FOG arrive whenever a tank is dropped, a separator dumps, or a saltwater line is flushed. This is not the steady food-processing feed most MBR-vs-CAS articles are written about.
Conventional activated sludge (CAS) fails this feed for three coupled reasons. First, FOG drives filamentous organisms such as Microthrix parvicella and Nocardia to outcompete floc formers, producing bulking sludge and a sludge volume index (SVI) routinely above 200-300 mL/g, which destroys clarifier performance. Second, dispersed oil floats as a scum blanket that escapes over the weirs and recontaminates the effluent; a DAF ahead of the aeration basin helps, but the downstream clarifier still has to settle oil-coated floc. Third, slow-growing hydrocarbon-degrading bacteria (typical μmax of 0.1-0.3 day⁻¹) wash out of a clarifier-limited system operating at SRT 5-10 days, which collapses the food-to-microorganism (F/M) margin and the system's ability to ride out a slug.
The City of Pompano Beach Industrial Pretreatment Program and Broward County Water & Wastewater Operations flag exactly these parameters — oil & grease, sulfides, total petroleum hydrocarbons, and salinity — on petroleum terminals and small re-refiners. The effluent bar is set by Florida Administrative Code 62-625 (NPDES surface-water discharge) and Chapter 62-620 (pretreatment), with additional reuse rules under FAC 62-610 where a site discharges to a reuse system. Throughout this article, BOD is 5-day biochemical oxygen demand (mg/L), COD is chemical oxygen demand (mg/L), F/M is food-to-microorganism ratio (kg BOD/kg MLSS·d), SRT is solids retention time (days), HRT is hydraulic retention time (hours), MLSS is mixed liquor suspended solids (mg/L), and FOG is fats, oils, and grease (mg/L).
For oily feeds, a dissolved air flotation unit sized for 20-40 m³/h with recycle ratios of 20-30% is the standard front-end; the MBR or CAS choice happens after FOG is reduced to a manageable level.
How a Conventional Activated Sludge System Treats Oily Water — and Where It Fails
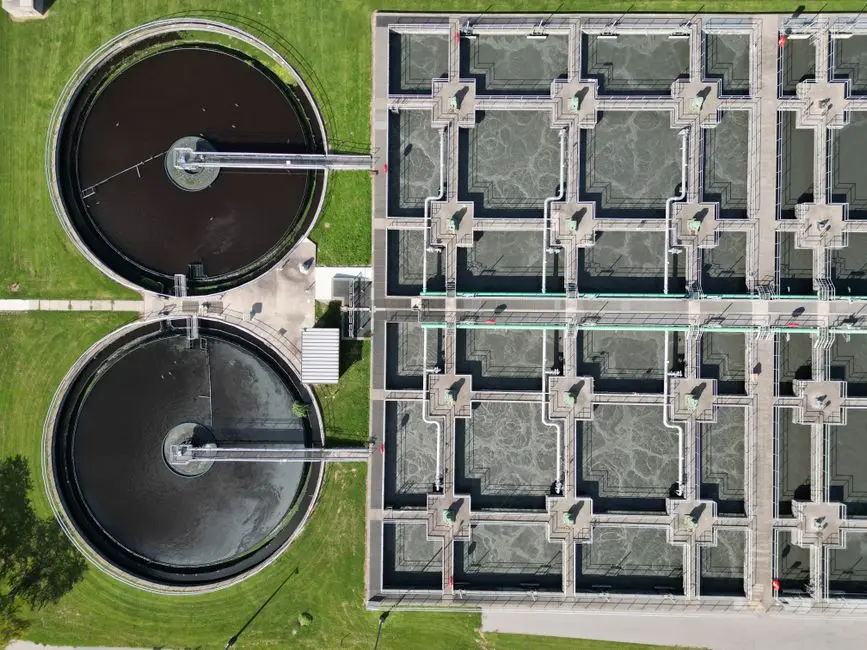
A standard CAS train at a Pompano Beach petroleum terminal looks like this: API or coalescing oil-water separator → equalization basin → DAF or CPI → aeration basin → secondary clarifier → sand or multimedia polish → chlorination or UV. Operating envelope is MLSS 2,000-4,000 mg/L, SRT 5-15 days, HRT 6-12 hours in the aeration basin, and F/M of 0.05-0.3 kg BOD/kg MLSS·d (per S3). The clarifier is the rate-limiting unit: hydraulic loading is held to 16-28 m³/m²·d, and any upset that drives SVI above 150 mL/g usually means a clarifier failure within 24-48 hours.
Effluent from a well-run CAS train on petroleum feed lands at 10-30 mg/L TSS and 50-150 mg/L COD (per S3) — adequate for sewer discharge under a 62-620 permit but rarely low enough to feed a reuse system without downstream multimedia filtration and possibly carbon polishing. The four failure modes that hit petroleum service hardest are Nocardia-type filamentous foaming when FOG slips past the DAF, rising sludge from denitrification when the anoxic zone is under-sized, oil fouling on clarifier launders and weirs that pushes TSS over 30 mg/L, and washout of slow-growing BTEX and PAH degraders when SRT drops below ~10 days.
CAS is still the right answer for a capital-constrained project on a brownfield with more than 0.5-1 acre of available biological-step footprint, no on-site reuse target, and an influent that has already been pre-treated to below ~50 mg/L FOG by a well-run DAF. For a deeper cost view, the 2026 oil refinery wastewater treatment cost breakdown shows CAS CAPEX for a 200 m³/d petroleum skid typically landing 20-50% below an MBR with equivalent pretreatment.
How a Membrane Bioreactor Handles the Same Feed
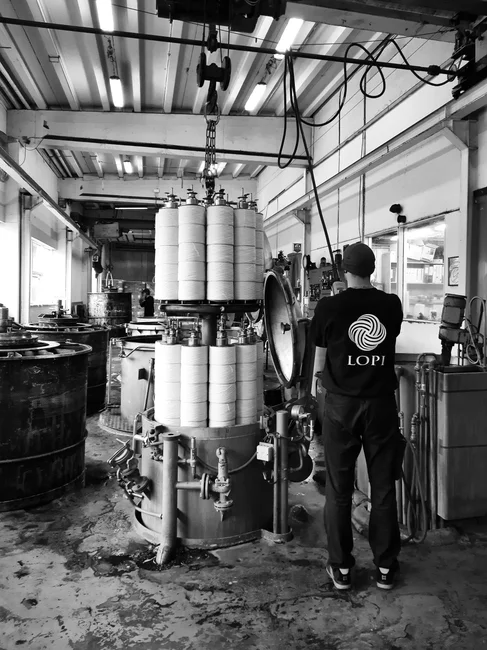
An MBR train for petroleum service is screening → grit removal → dissolved air flotation unit for FOG → equalization → anoxic zone → aerobic MBR basin with submerged DF series PVDF flat sheet membrane module at 0.1 μm pore size → UV or chlorine dioxide for reuse polishing, all packaged in an integrated MBR system with submerged PVDF membranes rated for 10-2,000 m³/d. The 0.1 μm pore is a physical barrier — every bacterium, most floc fragments, and essentially all dispersed oil droplets above that diameter stay inside the reactor.
MLSS in an MBR runs 8,000-15,000 mg/L (per S3 and the integrated MBR product datasheet, 2026), 3-5× higher than CAS. That is what changes the engineering trade-off: higher biomass means a smaller tank, a higher F/M tolerance per unit volume, and complete retention of slow-growing hydrocarbon degraders that would otherwise wash out of a clarifier. The hydraulic footprint is typically 30-50% smaller than a CAS train at the same loading (per S3), and as much as 60% smaller at higher loadings when the biological-step basin volume is the limiter.
MBR is not free of operating discipline. Required routines are membrane relaxation cycles every 8-15 minutes, continuous air-scour at 0.2-0.4 m³/m²·h under the modules, periodic chemical clean-in-place (CIP) with citric acid or NaOCl every 3-9 months, and membrane replacement on a 7-12 year cycle (per S3). Sludge production is lower than CAS — the higher SRT means more endogenous decay — but the sludge that is produced is finer and harder to thicken, which is why a HydropureWater plate and frame filter press is normally paired downstream for cake dryness of 22-28%.
The non-negotiable rule: an upstream DAF must drop FOG below ~50 mg/L before the membranes, or flux collapses within weeks as oil coats the PVDF surface and irreversible fouling sets in. Skipping the DAF is the most common cause of premature membrane failure in refinery MBR retrofits.
MBR vs CAS for Petroleum Wastewater: Head-to-Head Parameter Table
All ranges below are typical for a 100-500 m³/d petroleum or terminal feed after DAF pre-treatment, drawing on S3 and the integrated MBR product datasheet (2026). Energy and CAPEX figures are industry-typical ranges, not quotations.
| Parameter | MBR (submerged PVDF, 0.1 μm) | Conventional Activated Sludge |
|---|---|---|
| MLSS, mg/L | 8,000-15,000 | 2,000-4,000 |
| SRT, days | 20-60 (complete biomass retention) | 5-15 (clarifier-limited) |
| F/M ratio, kg BOD/kg MLSS·d | 0.05-0.15 | 0.1-0.3 |
| HRT, hours (aerobic) | 3-6 | 6-12 |
| Effluent TSS, mg/L | <1 (per 0.1 μm barrier) | 10-30 |
| Effluent COD, mg/L | <50 (typically 20-40) | 50-150 |
| Oil & grease in effluent, mg/L | <2 | 5-15 (post-DAF) |
| Footprint factor (vs CAS = 1.0) | 0.4-0.7 (30-50% smaller, up to 60% at high load) | 1.0 (baseline) |
| CAPEX premium | +20-50% over CAS | Baseline (lower) |
| Energy draw, kWh/m³ | 0.6-1.2 (membrane air-scour dominates) | 0.4-0.8 |
| Membrane / clarifier replacement | Membranes every 7-12 years | Clarifier mechanisms 15-25 years; weir repair 5-10 yr |
| Excess sludge yield | Lower (0.2-0.3 kg TSS/kg BOD removed) | Higher (0.4-0.6 kg TSS/kg BOD removed) |
| Operator skill required | Higher (membrane CIP, relaxation, SCADA) | Moderate (clarifier, SVI control, wasting) |
| Best fit | Reuse, tight sites, high FOG / shock, zero-discharge drivers | Large parcels, no reuse target, pre-treated low-FOG feed, capital-constrained |
Numbers marked "industry-typical" are conventional design ranges for petroleum service as of 2026; CAPEX and energy are project-specific and should be confirmed against an actual feed analysis.
Pompano Beach and Florida FDEP Compliance Lens
For a petroleum terminal or small re-refinery in the City of Pompano Beach service area, the controlling instruments are Florida Administrative Code 62-625 (NPDES surface-water discharge) and Chapter 62-620 (industrial pretreatment into a domestic POTW), with reuse standards under FAC 62-610 when effluent is routed to irrigation, cooling, or process reuse. The City of Pompano Beach Industrial Pretreatment Program and Broward County Water & Wastewater Operations enforce local discharge limits that typically sit at or below the FDEP floor for oil & grease (15 mg/L daily max for many petroleum categories), total sulfides, total petroleum hydrocarbons, pH 6.0-8.5, and chloride during coastal high-tide events.
The parameters that most often drive the biological-step choice are oil & grease, sulfide, salinity, and BOD/COD. MBR's stable, low-TSS, low-COD effluent typically clears FDEP reuse limits with only downstream disinfection via a UV sterilizer for reuse polishing at 30-40 mJ/cm², or chlorine dioxide at 0.5-1.0 mg/L residual. A CAS train at the same loading usually needs an additional multimedia filter step, and on tight sites the filter pad and clearwell consume the footprint savings the aeration basin was trying to capture.
Salinity is the wild card. Both technologies lose nitrification efficiency as chloride climbs above ~3,000-4,000 mg/L, but MBR's higher MLSS (8,000-15,000 mg/L) gives a small but real buffer because the slower-growing nitrifiers are fully retained inside the basin instead of being lost over a clarifier weir. That buffer matters at a coastal terminal where a single king-tide or saltwater-line flush can spike chloride from 250 mg/L to 5,000 mg/L inside an hour.
Decision Framework: When to Pick MBR vs CAS in a Pompano Beach Petroleum Project
Use this three-question test before specifying the biological step:
- Reuse or zero-liquid-discharge driver? (Yes → MBR. No → both still viable.)
- Is the biological-step footprint constrained below ~0.3-0.5 acre? (Yes → MBR. No → CAS is fine.)
- Will FOG exceed ~50 mg/L after DAF, or will BTEX or salinity swing more than 3× baseline? (Yes → MBR. No → CAS.)
If the answer to two or three is MBR-leaning, the typical configuration is DAF → equalization → anoxic zone → aerobic MBR with submerged PVDF modules at 0.1 μm → UV or chlorine dioxide for reuse polishing, with a HydropureWater plate and frame filter press downstream for sludge dewatering. Disinfection polish is usually a UV sterilizer for reuse polishing or, where residual is required for a reuse distribution loop, a chlorine dioxide generator sized for 0.5-1.0 mg/L ClO₂ residual.
If the answer is CAS-leaning, the typical configuration is DAF → equalization → aeration basin at MLSS 2,000-4,000 mg/L → secondary clarifier → multimedia filter → UV, with sludge handled by a HydropureWater plate and frame filter press at 22-28% dry solids.
| Project signal | Pick | Why |
|---|---|---|
| Site >1 acre, no reuse, FOG <50 mg/L after DAF, capital-constrained | CAS | 20-50% lower CAPEX, simpler operations, lower operator skill |
| Site <0.3 acre, reuse driver, FOG 50-200 mg/L, BTEX or salinity swings | MBR | 30-50% (up to 60%) smaller footprint, complete biomass retention, sub-1 mg/L TSS effluent |
| Existing CAS with stable influent, reuse added later | CAS + tertiary filter | Avoid scrapping working aeration; add multimedia and UV |
| FDEP reuse permit pending, zero-discharge target | MBR + RO | MBR effluent is suitable RO feed; CAS usually needs media + carbon first |
A quick CAPEX/OPEX sanity check for a 200 m³/d petroleum feed: MBR typically lands at 20-50% higher first cost (per S3) and 30-50% higher energy per m³ (per S3), but it eliminates the clarifier, reduces sludge volume by 30-50%, removes the need for tertiary filtration in many reuse cases, and produces effluent that an RO system can take directly for closed-loop reuse. For a Pompano Beach terminal paying both City sewer surcharges and potable-water costs, the reuse credit alone often closes the OPEX gap inside 3-5 years.
Frequently Asked Questions
Is MBR worth the 20-50% CAPEX premium over CAS for a small petroleum terminal in Pompano Beach?
It depends on whether reuse is in the project scope. If the terminal plans to reuse effluent for cooling, washdown, or irrigation under FAC 62-610, an integrated MBR system with submerged PVDF membranes usually pays back the 20-50% CAPEX premium (per S3) within 3-5 years through reduced potable-water purchases and sewer surcharges. If there is no reuse target and the site has more than 0.5 acre available, CAS remains the more economic choice for a small terminal.
How much FOG can an MBR handle, and what upstream protection is required?
An MBR with submerged PVDF membranes can tolerate short-term FOG spikes up to ~100-150 mg/L, but sustained operation above ~50 mg/L causes rapid, often irreversible flux loss. A dissolved air flotation unit ahead of the MBR, sized for 20-40 m³/h with 20-30% recycle, is non-negotiable for petroleum service to drop FOG to a level the membranes can handle.
What membrane replacement interval should I budget for a petroleum MBR?
Plan on 7-12 years for submerged PVDF modules operating on a properly pre-treated petroleum feed (per S3). Poor upstream FOG control, skipped CIP cycles, or sustained high-salinity operation can cut that to 4-6 years, which is the single largest unplanned OPEX line in a refinery MBR.
Does an MBR meet Florida FDEP Chapter 62-625 reuse limits without tertiary filtration?
For most petroleum parameters, yes. MBR effluent at <1 mg/L TSS and <50 mg/L COD (per S3) typically clears FAC 62-625 discharge and FAC 62-610 reuse thresholds with only UV or chlorine dioxide disinfection. CAS effluent at 10-30 mg/L TSS usually requires an additional multimedia or sand filter step to meet the same reuse criteria.
Which is more sensitive to salinity swings from seawater intrusion at a coastal terminal?
Both technologies lose nitrification efficiency above 3,000-4,000 mg/L chloride, but MBR has a small edge because the 8,000-15,000 mg/L MLSS fully retains the slow-growing nitrifier population inside the basin, while a CAS clarifier can wash out a meaningful fraction during a high-chloride event. Neither technology eliminates the need to control saltwater infiltration at the source.