What Oil Refinery Wastewater Actually Contains in 2026
Refinery effluent treatment starts with a contaminant baseline most EPC bid templates get wrong. A modern refinery WWTP typically sees COD 500–1,200 mg/L, BOD 250–600 mg/L, oil & grease 50–300 mg/L, total suspended solids 100–400 mg/L, sulfide 20–100 mg/L, phenols 10–50 mg/L, and ammonia 20–80 mg/L — the parameter envelope documented for the Al-Daura refinery MBR study in Baghdad (Springer Arabian Journal for Science and Engineering, 2024). Spent caustic, desalter brine, and tank-farm runoff push individual parameters outside these bands during upset events, which is why the unit operations below are sized to the upper third of each range rather than the average.
Free oil must be reduced below 50 mg/L upstream of any biological step, or the MBR will foul within weeks and the operator will be replacing cassettes months ahead of schedule. That single constraint fixes the position of the dissolved air flotation system at the head of the train. Gravity separation (API separators, corrugated plate interceptors) handles only free oil; emulsified and dissolved oil responds poorly without chemical demulsifier, and DAF is justified economically only when influent oil & grease exceeds ~30 mg/L — a threshold most refinery influents clear by a factor of three.
| Parameter | Typical refinery influent (mg/L) | Pre-treatment target (mg/L) | Driver |
|---|---|---|---|
| COD | 500–1,200 | < 600 (post-DAF) | MBR loading rate |
| BOD | 250–600 | < 300 | Aeration basin sizing |
| Oil & grease | 50–300 | < 50 (DAF), < 5 (post-MBR) | MBR membrane fouling |
| TSS | 100–400 | < 80 (post-DAF) | Equalization turnover |
| Sulfide | 20–100 | < 5 (post-oxidation) | MBR oxygen demand, odor |
| Phenols | 10–50 | < 0.5 (post-MBR) | Discharge consent |
| Ammonia | 20–80 | < 5 (post-MBR) | RO feed, toxicity |
The 2026 Process Train: Why DAF → MBR → RO
DAF at 4–25 m³/h per unit achieves 85–95% free oil removal and 60–80% TSS reduction using 30–60 mg/L of cationic polyacrylamide; the DAF line covers the 4–300 m³/h capacity band that handles the full range from a 500 m³/day satellite refinery up to a 5,000 m³/day integrated complex. Effluent from DAF flows to an equalization basin sized at 8–12 hours of hydraulic retention, with nutrient (urea/phosphoric acid) and antifoam dosing to balance C:N:P at roughly 100:5:1 before the biological step.
The submerged MBR system uses 0.1 µm PVDF hollow-fiber modules in the DF cassette series, operating at 10–12 kg COD/m³·d with mixed liquor suspended solids at 8,000–12,000 mg/L. MBR effluent typically lands at COD < 50 mg/L, oil < 5 mg/L, and ammonia < 5 mg/L — clean enough that an industrial RO polishing train can run on it without aggressive antiscalant dosing. Polishing RO at 70–85% recovery (up to 95% with two-pass) brings TDS below 500 mg/L, the threshold for cooling-tower make-up, which is the dominant reuse target in refineries because a 50,000 bbl/d refinery draws 4,000–8,000 m³/day of cooling water and 60–80% of that can be offset by treated effluent.
The economic case for MBR between DAF and RO is the most under-appreciated part of a refinery reuse train. Without MBR polishing, RO membranes foul 3–5× faster and the operator burns through CIP cycles at twice the rate — that single decision is the biggest avoidable cost line in any refinery reuse package.
CAPEX Breakdown by Unit Operation (2026 USD)
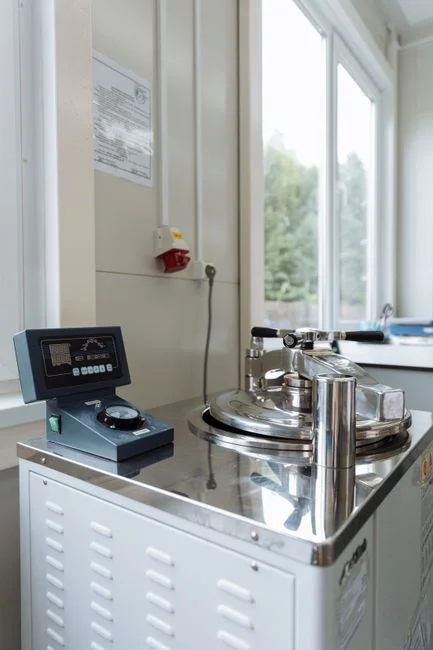
For a 500–5,000 m³/day refinery WWTP, the 2026 total CAPEX envelope is $1.2M–$8.5M, with each block of the train falling into a defensible per-unit range. The numbers below are engineering benchmarks synthesized from refinery MBR case studies and standard DAF/MBR/RO product data ranges (HydropureWater field data, 2026); site-specific factors (H₂S concentration, ambient temperature, discharge consent) shift individual lines by ±25%.
| Unit operation | Capacity / scope | 2026 CAPEX band (USD) | Key cost driver |
|---|---|---|---|
| DAF pre-treatment skids (316L, 13 standard models) | 4–25 m³/h per skid | $45K–$180K per skid | Air-saturation system, skimmer |
| Equalization + chemical dosing | Tank + PLC scope | $30K–$110K | Tank volume, dosing pump count |
| Submerged MBR system (DF cassettes) | 10–2,000 m³/day | $180K–$1.4M | Membrane area, cassette count |
| RO polishing train | 50–80% of feed flow | $220K–$1.8M | Pressure class, energy recovery |
| Sulfide pre-oxidation (NaClO or H₂O₂) | Inline skid | $15K–$60K | Dosing pump, ORP probe |
| Sludge handling (plate-and-frame press) | 0.5–3 m³/h cake | $80K–$260K | Frame count, cake dryness |
| Total packaged system | 500–5,000 m³/day | $1.2M–$8.5M | — |
The MBR cassette replacement reserve runs $25–$45/m² every 5–7 years — set this aside as a sinking fund rather than treating membrane replacement as a surprise. PLC-controlled chemical dosing skids for sulfide oxidation, antifoam, and CIP chemicals are a small CAPEX line ($15K–$60K) but they pin a much larger OPEX commitment, which is why the pre-oxidation skid deserves its own specification line in the RFQ.
OPEX per Cubic Meter: Where the Money Actually Goes
Total 2026 OPEX for a DAF + MBR + RO train runs $0.55–$2.40/m³ treated, with reuse-quality RO pushing the upper band. The split is roughly: energy 25–40%, chemicals 20–35%, membrane replacement 10–18%, labor and maintenance 10–15%, sludge handling 5–10%. A 1,000 m³/day refinery reusing 60% of its effluent spends $200K–$870K per year on OPEX, which is the number to anchor any 5-year TCO conversation with finance.
Energy is dominated by two line items. MBR aeration draws 0.3–0.5 kWh/m³ to keep dissolved oxygen above 2 mg/L in the membrane tank; RO high-pressure pumping draws 0.6–1.1 kWh/m³ at 70–85% recovery, climbing above 1.4 kWh/m³ if recovery is pushed past 85% without energy-recovery devices. At Gulf Cooperation Council industrial tariffs of $0.05–$0.08/kWh, that energy envelope translates to $0.05–$0.13/m³ just for pumping and aeration combined.
Chemicals (demulsifier, NaOH for pH/sulfide control, antiscalant, CIP acids and alkali, NaClO for pre-oxidation) typically run $0.12–$0.55/m³; sulfide-laden crudes from Middle Eastern and Indian fields push this to the high end. Membrane replacement reserve works out to $0.04–$0.09/m³ amortized for MBR cassettes over a 5–7 year life and $0.08–$0.18/m³ for RO elements over 3–5 years. Sludge handling via plate-and-frame filter press adds $0.05–$0.12/m³ in polymer and disposal cost — a small line but one that consistently falls out of early-stage estimates.
Process Comparison: DAF-Only vs DAF + MBR vs Full Reuse
Scope selection drives cost more than vendor selection. Many refineries over-buy reuse capacity they do not need, while others under-spec biological polishing and pay for it in RO membrane replacement. The three configurations below cover what an EPC procurement lead will actually be asked to bid.
| Configuration | Effluent quality | OPEX (USD/m³) | Best-fit use case |
|---|---|---|---|
| DAF only (with API/CPI upstream) | O&G < 20 mg/L, COD 250–500 mg/L | $0.25–$0.55 | Pre-treatment to a marine outfall or centralized treatment park; rarely sufficient in 2026 due to tightening effluent COD consents (per EPA 40 CFR 435 and equivalent regional standards) |
| DAF + MBR (no RO) | COD < 50 mg/L, NH₃ < 5 mg/L, O&G < 5 mg/L | $0.55–$1.10 | Discharge to surface water or cooling-tower bleed with periodic blowdown control; meets typical 100 mg/L COD consents |
| DAF + MBR + RO (reuse) | TDS < 500 mg/L, conductivity < 800 µS/cm | $1.10–$2.40 | 60–80% freshwater offset in refineries above 1,000 m³/day; the only configuration that reliably hits cooling-tower make-up spec |
| Full ZLD (add brine concentrator + crystallizer) | Zero liquid discharge | $4.00–$8.00 (equivalent) | Rarely economic for refinery duty below 2,000 m³/day; reserve as a cost ceiling so competing bidders do not oversell it |
For a 1,000 m³/day refinery in a water-stressed jurisdiction, the DAF + MBR + RO configuration is the engineering default. For a 300 m³/day satellite refinery with cheap raw water nearby, DAF + MBR alone is usually the right answer — and the OPEX differential over a 10-year life is roughly $2M in favor of stopping at MBR.
Cost Drivers That Move the Estimate More Than 20%
Four leverage points move the budget more than any equipment line item, and most RFQs under-specify at least one of them. First, influent sulfide above 50 mg/L forces NaClO or H₂O₂ pre-oxidation and adds $0.10–$0.25/m³ in OPEX — a cost that is routinely missed in early budgets because sulfide does not show up on a standard COD/BOD panel.
Second, oil & grease spikes above 300 mg/L during desalter upset events require a larger DAF with polymer dose doubling; the engineering hedge is to oversize the DAF by 30% relative to the design average, which adds roughly $20K–$50K to CAPEX but saves six figures in avoided cassette replacement over the asset life. Third, RO recovery above 80% raises scaling risk and antiscalant cost nonlinearly — 70–75% is the engineering sweet spot for refinery brine chemistry, and pushing past it for a marginal gain in permeate yield is one of the most common OPEX errors in this kind of plant.
Fourth, site-specific factors swing the estimate by ±25%: ambient temperature below 15 °C slows membrane biology and forces a heated enclosure or a larger reactor; feedwater TDS above 3,000 mg/L drives the RO pressure class up by one stage and the pump cost with it; discharge consent below 60 mg/L COD forces MBR regardless of whether reuse is the target. The OPEX and CAPEX benchmarks in this article assume a Gulf Coast or Southeast Asian baseline; arid Middle East sites will run 10–15% higher on water-make-up value but 5–10% lower on heating energy.
Frequently Asked Questions
Q1: What is the realistic 2026 cost per cubic meter for treating refinery wastewater to reuse standard?
For a 1,000 m³/day plant using DAF + MBR + RO, the 2026 OPEX band is $1.10–$2.40/m³ treated, with a CAPEX envelope of $2.5M–$4.5M for the packaged system. Smaller plants (500 m³/day) sit at the upper end of OPEX because fixed costs are amortized over less volume; larger integrated refineries (5,000 m³/day) drop toward the lower end.
Q2: Can a small refinery under 200 m³/day afford a DAF + MBR + RO train, or is biological-only more realistic?
Below 200 m³/day, RO is rarely economic unless the site is in a water-stressed jurisdiction with raw-water costs above $2/m³. The defensible scope is DAF + MBR to discharge consent, with RO held as a future phase. Capital cost for a packaged DAF + MBR at 200 m³/day runs $250K–$450K.
Q3: How long does refinery wastewater take to treat end-to-end through DAF, MBR, and RO?
Hydraulic residence time is roughly 0.5–1 hour in DAF, 6–10 hours in equalization, 8–12 hours in the MBR aeration basin, and 2–4 hours in the RO pressure vessel train. End-to-end, the system delivers treated reuse water within 18–28 hours of influent arrival, with the MBR being the rate-limiting step.
Q4: Which influent parameter most inflates OPEX in a refinery wastewater plant?
Sulfide concentration has the largest OPEX leverage because it drives both pre-oxidation chemical cost and MBR oxygen demand. A refinery running 80 mg/L sulfide spends roughly $0.20/m³ more on chemicals and energy than the same plant running 20 mg/L sulfide — a $73K/year swing at 1,000 m³/day.
Q5: Is water reuse from refinery wastewater safe for boiler feed, or only cooling-tower make-up?
RO permeate from a DAF + MBR + RO train is suitable for low-pressure boiler feed (≤ 40 bar) after polishing through a mixed-bed deionizer; high-pressure boilers above 80 bar require additional condensate-quality polishing. Cooling-tower make-up is the most common reuse target because it tolerates higher TDS and accepts the RO permeate directly without further treatment.
Related Equipment
- industrial RO polishing train — specifications, capacity range, and technical data