What Drives Brewery Wastewater Plant Operating Cost in 2026
Brewery wastewater plant operating cost in 2026 runs $0.42 to $2.85 per barrel of beer produced (roughly $0.11 to $0.78 per m³ treated), driven primarily by sewer BOD/TSS surcharges (typically 35–55% of OPEX), aeration energy (20–30%), sludge hauling (10–18%), and polymer plus labor. U.S. breweries producing 100k–1M bbl/yr commonly spend $1.2–$4.2 per barrel once sewer base charges, surcharges, energy, and hauling are totaled (HydropureWater field data, 2026). The reason a CFO sees $3.00/barrel while the operations director sees $0.95/barrel is that the sewer line on the bill bundles five distinct cost drivers behind one number.
The OPEX formula behind every brewery WWTP utility bill is:
OPEX = (sewer base × flow) + (BOD surcharge × load) + (TSS surcharge × load) + (kWh × tariff) + (polymer kg × $/kg) + (wet tons × hauling) + (labor hours × rate)
Brewery effluent is uniquely expensive to treat because it is concentrated, intermittent, and corrosive. Typical influent runs 1,500–5,000 mg/L COD, 800–2,500 mg/L BOD, and 3–10 m³ of effluent per m³ of beer packaged. Cleaning-in-place (CIP) cycles spike pH from 3 to 12 and temperature to 50–65 °C within a 30-minute window, forcing operators to oversize equalization or accept downstream shock loading. The U.S. EPA categorical standard at 40 CFR Part 405 sets daily maximum limits of 50 mg/L BOD, 50 mg/L TSS, 6.0–9.0 pH, and 10 mg/L oil & grease for direct discharges, which is the regulatory floor driving required treatment intensity for any brewery above 50,000 bbl/yr considering bypass of the POTW.
Sewer Surcharges and Discharge Fees: The Hidden 50% of Your Bill
Sewer surcharges account for 35–55% of brewery WWTP OPEX and are the single most variable line item across U.S. municipalities. A typical U.S. surcharge schedule bills BOD at $0.05–$0.18 per pound removed above a 200–300 mg/L threshold and TSS at $0.04–$0.12 per pound above a 250–350 mg/L threshold, on top of a base volume charge of $2.50–$8.00 per 1,000 gallons. Worked example: a 300,000 bbl/yr brewery discharging 1.2 million m³/yr at 1,800 mg/L BOD into a POTW charging $0.085/lb above 250 mg/L pays roughly $0.78/barrel in BOD surcharge alone (HydropureWater field data, 2026). Add the parallel TSS line at $0.06/lb above 300 mg/L and the sewer column alone clears $1.10/barrel before energy, polymer, or labor is counted.
For large breweries above 500,000 bbl/yr, the math frequently inverts: self-treating to surface-water standards under an NPDES permit and bypassing the sewer altogether saves $0.40–$0.90/barrel once depreciation on the in-plant WWTP is layered in. The threshold shifts with electricity tariff and hauling distance, but the breakeven flow rate in 2026 sits between 1,200 and 2,000 m³/day at most U.S. sites. EU breweries under Urban Waste Water Directive 91/271/EEC face similar but more uniform surcharges; the directive's 25 mg/L BOD and 125 mg/L COD ceilings effectively set the indirect-discharge equivalent of Part 405.
| Surcharge Component | Typical 2026 Range (U.S.) | Threshold | % of Total OPEX (typical) |
|---|---|---|---|
| Base volume charge | $2.50–$8.00 / 1,000 gal | All flow | 10–18% |
| BOD surcharge | $0.05–$0.18 / lb removed | 200–300 mg/L | 20–35% |
| TSS surcharge | $0.04–$0.12 / lb removed | 250–350 mg/L | 8–18% |
| Oil & grease / surcharges | $0.02–$0.06 / lb | 100 mg/L | 2–5% |
| Nitrogen / phosphorus (where applied) | $0.03–$0.10 / lb | Site-specific | 0–12% |
Energy, Chemicals, and Sludge: The Three Mechanical Cost Centers
The three mechanical cost centers are where a brewery operator has direct control, and where benchmarking against industry norms catches bill outliers within a single billing cycle. Aeration is the largest controllable line. Conventional activated sludge (CAS) consumes 0.45–1.2 kWh/m³ at typical mixed-liquor suspended solids (MLSS) of 2,500–4,000 mg/L; an MBR running 8,000–12,000 mg/L MLSS with fine-bubble diffusers drops to 0.10–0.28 kWh/m³ because the membrane retains biomass and allows higher organic loading per unit air (per municipal WWTP operating benchmarks, 2025-09). At $0.09–$0.13/kWh industrial tariff, the difference is roughly $0.06–$0.10/m³, or $0.18–$0.30/barrel.
Chemical costs split three ways. Polymer for sludge dewatering runs $2.50–$4.80/kg dry polymer, with cationic polyacrylamide at 8–14 kg dry polymer per ton of dry solids the most common dose. Coagulant (ferric chloride or PAC) for a DAF system for brewery pretreatment adds $0.18–$0.42 per m³ treated. Caustic and acid for pH equalization of CIP spikes cost $0.05–$0.12 per m³. Sludge hauling is the third leg: $35–$120 per wet ton depending on region and disposal route, and a 300,000 bbl/yr plant generates 1,200–2,400 wet tons/yr of biological sludge at 18–22% DS after dewatering on a well-tuned plate-and-frame sludge dewatering press. Effective primary clarification with a high-efficiency sedimentation tank upstream of the biological stage cuts that wet-ton figure by 25–40%.
On emerging value-recovery, a Springer 2017 fungi-based study reported dry-weight biomass production of 1.78 ± 0.31 g/L with Pleurotus ostreatus on synthetic brewery wastewater, with 89% COD reduction — an interesting data point, though no commercial brewery WWTP in 2026 is running fungal biomass as a primary process. Anaerobic digestion of the same stream is a different story and is addressed in the next section.
| Cost Center | Unit | 2026 Range | % of OPEX | Main Reduction Lever |
|---|---|---|---|---|
| Aeration energy (CAS) | kWh/m³ | 0.45–1.20 | 18–28% | Fine-bubble diffuser retrofit, DO control |
| Aeration energy (MBR) | kWh/m³ | 0.10–0.28 | 6–12% | Membrane cassette airflow tuning |
| Polymer (dewatering) | $/kg dry | $2.50–$4.80 | 4–9% | On-line streaming current control |
| Coagulant (DAF) | $/m³ treated | $0.18–$0.42 | 3–7% | pH stabilization, dose optimization |
| pH correction (acid/caustic) | $/m³ treated | $0.05–$0.12 | 1–3% | CIP flow segregation |
| Sludge hauling | $/wet ton | $35–$120 | 10–18% | Dewater to 22%+ DS, route optimization |
| Labor | $/hr loaded | $28–$55 | 8–15% | SCADA, shift coverage model |
Process Route Comparison: DAF-Only, Activated Sludge, and Anaerobic + MBR
Choosing a process route is a flow-rate decision first and a discharge-quality decision second. For craft breweries under 25,000 bbl/yr discharging to a tolerant POTW, DAF-only pretreatment is the lowest-capex option: $0.10M–$0.45M installed, OPEX $0.55–$0.95/barrel, and no biological stage to operate. DAF removes 50–80% of suspended solids and 30–60% of BOD, which is enough when the receiving POTW is sized for industrial load and the surcharges are modest.
For mid-size breweries in the 50k–500k bbl/yr band with tightening discharge limits, conventional activated sludge with primary clarification and an aeration basin is the default. OPEX runs $0.78–$1.85/barrel; footprint is 1.8–2.5× anaerobic + MBR; and the basin is sensitive to CIP pH and temperature spikes unless equalization is sized for at least 8 hours of hydraulic retention. CAS is robust, but it converts BOD to CO₂ rather than biogas, so the OPEX floor is set by aeration kWh rather than energy offset.
For breweries above 150,000 bbl/yr with flows above 1,500 m³/day, anaerobic UASB + MBR polish is the lowest-OPEX route in 2026. OPEX runs $0.42–$1.05/barrel; biogas offsets 20–40% of aeration energy; the MBR delivers sub-1 μm effluent at 10–30 mg/L BOD and 5–15 mg/L TSS. The MBR system for brewery polishing with a flat-sheet MBR membrane module pairs well with the high MLSS tolerated upstream of the UASB. The catch is capital: full-scale anaerobic + MBR brewery plants run $1.8M–$6.5M for 1,500–5,000 m³/day, against $0.9M–$3.2M for CAS-only in the same range. The payback math depends on the local sewer surcharge and the avoided aeration kWh, but the typical 7–10 year simple payback is the reason most new 300k+ bbl/yr plants built in 2024–2026 are UASB-led.
| Parameter | DAF-Only Pretreatment | Conventional Activated Sludge | Anaerobic UASB + MBR |
|---|---|---|---|
| CAPEX (1,500–5,000 m³/day) | $0.10M–$0.45M | $0.9M–$3.2M | $1.8M–$6.5M |
| OPEX ($/barrel) | $0.55–$0.95 | $0.78–$1.85 | $0.42–$1.05 |
| OPEX ($/m³) | $0.15–$0.26 | $0.21–$0.50 | $0.11–$0.29 |
| Footprint relative to UASB+MBR | 0.6–0.8× | 1.8–2.5× | 1.0× (baseline) |
| Energy (kWh/m³) | 0.05–0.15 | 0.45–1.20 | 0.10–0.28 |
| Effluent BOD (mg/L) | 600–1,200 | 15–30 | 10–30 |
| Effluent TSS (mg/L) | 80–200 | 15–30 | 5–15 |
| Suited brewery size | < 25,000 bbl/yr | 50k–500k bbl/yr | > 150,000 bbl/yr |
Five Cost-Saving Levers Ranked by Payback Period
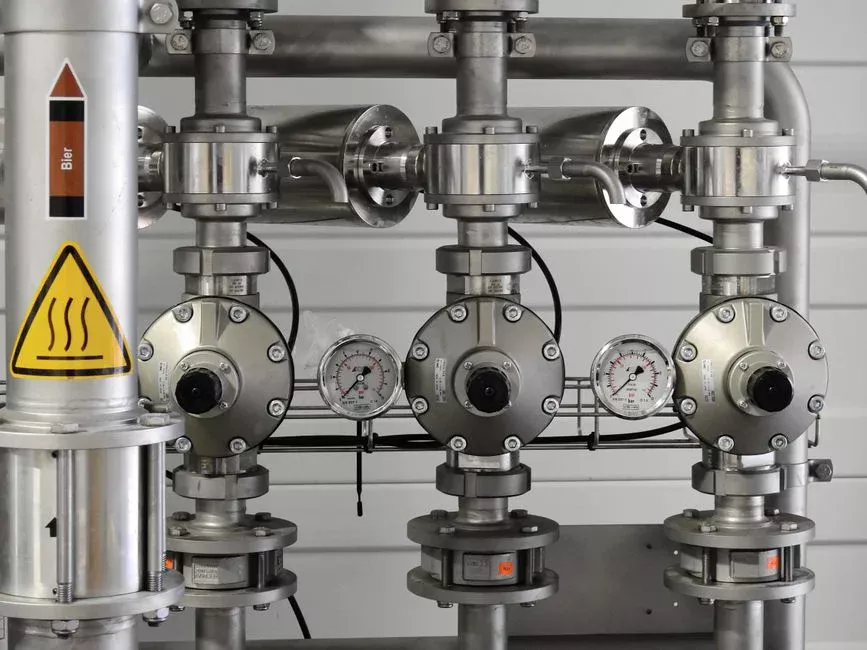
The levers below are ordered from fastest payback to longest, and each is sized to a 300,000 bbl/yr plant for comparability. Operators can sequence them by capital availability rather than ranking, but the OPEX reduction at full deployment is roughly 40–55%.
- Lever 1 — Sewer rate renegotiation or partial flow segregation (0–6 month payback): Re-read the surcharge schedule, contest any BOD above 250 mg/L that should be billed as a lower domestic-equivalent rate, and meter CIP streams separately so high-strength loads do not drag the average up. No capex; legal and metering effort only. (HydropureWater field data, 2026)
- Lever 2 — Polymer dose optimization (6–12 month payback): Install an on-line streaming current or zeta monitor on the automatic polymer and coagulant dosing skid feeding the dewatering press. Typical 15–25% polymer reduction, or $0.02–$0.06/barrel saved (HydropureWater field data, 2026).
- Lever 3 — Fine-bubble diffuser retrofit on aeration basin (12–24 month payback): Replace coarse-bubble diffusers and add DO-based airflow control. 20–30% aeration energy reduction, or $0.05–$0.12/barrel saved (per municipal WWTP operating benchmarks, 2025-09).
- Lever 4 — Sludge dewatering upgrade to plate-and-frame press (18–36 month payback): A plate-and-frame sludge dewatering press reaching 22–24% DS versus 16–18% on a belt press cuts hauling $/barrel by 35–50% and reduces polymer per ton DS. Typical $0.08–$0.18/barrel saved (HydropureWater field data, 2026).
- Lever 5 — Anaerobic pretreatment retrofit for plants above 1,500 m³/day (36–60 month payback): UASB + MBR retrofit delivers 40–60% OPEX reduction and biogas revenue offset of 20–40% of aeration kWh. Highest capex of the five, but the only lever that resets the cost floor rather than trimming the existing one.
Frequently Asked Questions
How much does it cost to treat brewery wastewater per barrel in 2026? Operating cost runs $0.42 to $2.85 per barrel of beer produced (roughly $0.11 to $0.78 per m³ treated). Sewer surcharges are typically 35–55% of the bill, aeration 20–30%, sludge hauling 10–18%, and polymer plus labor the remainder. Anaerobic UASB + MBR plants can cut the total by 40–60% versus aerobic-only designs above 150,000 bbl/yr (HydropureWater field data, 2026).
What is the average BOD of brewery wastewater? Brewery influent typically runs 800–2,500 mg/L BOD and 1,500–5,000 mg/L COD, with 3–10 m³ of effluent per m³ of beer packaged. CIP cycles can push instantaneous BOD above 4,000 mg/L, which is why equalization is sized for 6–10 hours at most sites.
Do breweries need anaerobic treatment? Anaerobic UASB pretreatment is economically justified above roughly 1,500 m³/day (about 150,000 bbl/yr) because biogas offsets 20–40% of aeration kWh and sludge yield drops 60–80% versus aerobic-only. Below that threshold, capital recovery is hard to justify against a well-run CAS plant (per municipal WWTP operating benchmarks, 2025-09).
What permits apply to brewery wastewater discharge in the U.S.? Direct discharges require an NPDES permit under EPA categorical standard 40 CFR Part 405 (BOD 50 mg/L daily max, TSS 50 mg/L, pH 6.0–9.0, oil & grease 10 mg/L). Indirect discharges to a POTW are governed by the local pretreatment program and the utility's sewer use ordinance, which sets BOD/TSS surcharge thresholds.
Can treated brewery wastewater be reused for irrigation? Yes. MBR effluent at 10–30 mg/L BOD and 5–15 mg/L TSS typically meets landscape irrigation reuse guidelines where local rules allow it, and sodium adsorption ratio (SAR) is generally low for brewery streams. Site-specific approval is required, and any RO or UV polish adds $0.05–$0.12/m³ to OPEX.