What a Wastewater KPI Dashboard Actually Does
A digital dashboard for wastewater KPI is a layered software stack (L1 PLC, L2 SCADA, L3 historian, L4 BI/web) that ingests 12–16 online sensor streams per major process and surfaces 8–15 prioritized KPIs — influent load, BOD/COD removal efficiency, effluent compliance (TSS, NH3-N, P), aeration energy kWh/m³, and chemical dose ratio. A 2026-grade dashboard updates at 1–10 second polling, retains 5+ years of historian data, and feeds EPA 40 CFR Part 133 and EU UWWTD 91/271/EEC compliance reports automatically.
Treating the dashboard as a "fancier SCADA screen" is the most common failure mode. The HMI is only L2 of five: L0 field sensors (pH, DO, TSS, NH3-N, flow, COD proxy), L1 PLC/RTU running closed-loop control, L2 SCADA HMI for operator visualization, L3 process historian (OSIsoft PI, AVEVA, Wonderware, Ignition) for time-series storage, and L4 BI/analytics layer (Power BI, Grafana, Qlik) for cross-process KPIs and reports. The 2026 standard polling rate is 1–10 s at L2 with 1-min compression in the historian, while raw 100-ms capture is reserved for compliance-critical points feeding EPA Discharge Monitoring Reports (DMRs).
KPIs cluster into four families: influent load (kg/d BOD, TSS, NH3-N), process performance (removal efficiency, SOTE, MLSS), effluent compliance (TSS, BOD, NH3-N, TP against permit limits), and resource efficiency (aeration kWh/m³, polymer kg/kg, P-recovery ratio). EPA 40 CFR Part 133 and the EU Urban Wastewater Treatment Directive 91/271/EEC are the regulatory drivers that convert dashboards from optional visualization into permit-required infrastructure — most U.S. NPDES permits now require electronic DMR submission, and ISO 14001 and EN 15873 reporting both depend on long-term time-series data that only a historian retains.
The 5-Level Reference Architecture
Each layer in the architecture speaks a specific protocol, and getting the protocol map wrong is the most expensive mistake a system integrator can make. The table below is the reference set most 2026 WWTP projects ship with.
| Level | Function | Typical Devices | 2026 Protocol |
|---|---|---|---|
| L0 — Field | Sensing & actuation | pH, DO, TSS, NH3-N, magnetic flow, VFD drives | 4–20 mA + HART, Modbus RTU, IO-Link |
| L1 — Control | PLC / RTU, closed-loop control | Allen-Bradley CompactLogix, Siemens S7-1500, Schneider M580 | Modbus TCP, EtherNet/IP, Profinet |
| L2 — SCADA | Operator HMI, alarming | Ignition, AVEVA System Platform, WinCC | OPC UA DA, MQTT/Sparkplug B |
| L3 — Historian | Time-series storage, compliance archive | OSIsoft/AVEVA PI, Wonderware Historian, Ignition Tag Historian | SQL, OPC UA, PI Connector |
| L4 — Analytics | BI dashboards, reports, ML | Power BI, Grafana, Python notebooks | REST APIs, Kafka, OPC UA Pub/Sub |
Greenfield plants in 2026 should standardize on OPC UA over MQTT with Sparkplug B for L2→L3 transport, which gives 1-second pub/sub semantics, payload compression, and clean cloud hand-off. Brownfield retrofits typically keep legacy L1 protocols and add an OPC UA DA bridge (e.g., Kepware, Matrikon) to feed the historian without rewriting PLC code.
Cybersecurity follows IEC 62443 zone-conduit: the L0–L1 OT zone is air-gapped or behind a unidirectional data diode, the L3–L4 IT zone sits on the business network, and a DMZ hosts the historian replica that both sides can read. For critical sites, water utility CISA guidance now recommends physical data diodes rather than firewalls for the L2↔L3 hop.
Storage budgeting is straightforward: a 50,000-tag plant at 1-minute compression averages ~70 GB/year compressed, or roughly 350 GB over a 5-year retention window, which fits comfortably on a single on-premise server or an inexpensive cloud blob tier. For protocol and SCADA configuration specifics, the 2026 SCADA engineering guide for industrial wastewater plants covers device-level tag mapping in detail.
The 8 KPIs That Belong on a WWTP Dashboard
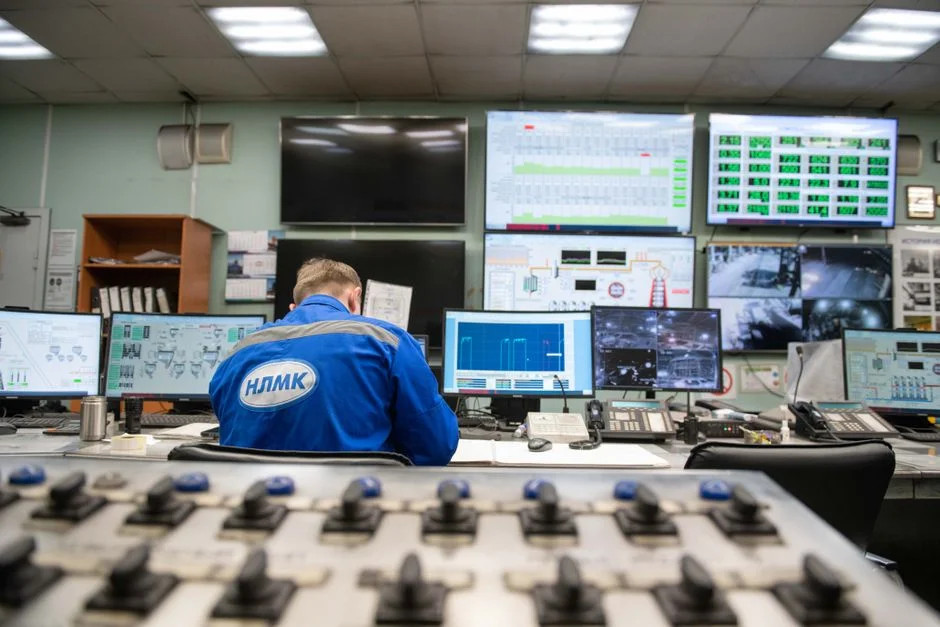
Most plant engineers overload the dashboard with 40+ tags and under-load it with decisions. The eight KPIs below cover >90% of the questions an operations manager, a regulator, or a CFO will ask, and each has a defensible formula, a target range, and an alarm threshold tied to a regulatory or operating baseline. Alarm setpoints are deliberately set at 75% of the regulatory limit for compliance KPIs, which gives operations a 6–12 hour corrective window before a permit excursion — the single most consequential engineering decision a dashboard designer makes.
| # | KPI | Formula | Target / Typical Range | Alarm Threshold | Regulatory Basis |
|---|---|---|---|---|---|
| 1 | Influent load (kg/d) | C × Q × 86.4 / 1000 | 200–400 mg/L BOD (municipal) | ±20% of 7-day rolling mean | UWWTD 91/271/EEC |
| 2 | Removal efficiency (%) | (Cin – Cout) / Cin × 100 | BOD 85–95%, COD 80–90%, NH3-N 90–98%, TP 85–95% | –5% from 30-day baseline | EPA 40 CFR §133.102 |
| 3 | Effluent compliance (mg/L) | 24-h composite / online probe | TSS ≤30, BOD ≤30, NH3-N ≤10, TP ≤2 | 75% of permit limit | NPDES / 40 CFR Part 133 |
| 4 | Aeration energy intensity (kWh/m³) | Blower kWh / Treated m³ | 0.15–0.35 conventional, 0.08–0.20 MBR | +15% from baseline | ISO 50001 / EU EED |
| 5 | SOTE (%) | 2.0–3.5 kg O₂/kWh @ fine-bubble | Drop >20% from commissioning = fouling | 20% SOTE drop | ASCE MOP 8 design check |
| 6 | Sludge yield (kg TSS/kg BOD) | WAS TSS × WAS flow / BOD removed | 0.3–0.5 conventional | Sudden ±0.1 change | Process control only |
| 7 | Chemical dose ratio | kg chemical / kg pollutant removed | Coagulant 1.0–2.0; polymer 0.005–0.02 | +25% from baseline | Optimisation, not regulatory |
| 8 | Compliance hours (%) | Hours within permit / total hours | 100% target | <99% rolling 30-day | NPDES permit, UWWTD reporting |
KPI 1, influent load, is the master feed-forward parameter: a 10% spike in kg/d BOD is the earliest warning of toxic inhibition, and the aeration control loop should ramp DO setpoint automatically when this KPI breaks its band. KPI 2, removal efficiency, is computed inline as a 24-h moving average to suppress diurnal noise. KPI 3 — effluent compliance — is the only KPI that should map directly to an auto-DMR export. KPIs 4 and 5 are the energy pair: aeration typically consumes 50–60% of a plant's grid draw, so pairing KPI 4 (kWh/m³) with KPI 5 (SOTE) gives operations the diagnostic resolution to distinguish "blower is inefficient" from "diffusers are fouled".
KPI 6, sludge yield, doubles as a toxicity canary: a sudden drop from 0.4 to 0.2 kg TSS/kg BOD removed usually indicates nitrification inhibition or a heavy-metal slug, often 24–48 h before effluent NH3-N breaks permit. KPI 7, chemical dose ratio, is the optimisation lever; pairing it with the online phosphate analyzer engineering guide for WWTPs lets operators tune coagulant on a real P signal rather than a 24-h lab grab. KPI 8, compliance hours, is the single number quoted in board reports and in any enforcement negotiation; it should be a 30-day rolling figure, not a daily snapshot, to avoid alarm churn. For high-load industrial applications, the 2026 MBR market growth and technology shift outlook provides the energy-baseline numbers behind KPI 4 in the 0.08–0.20 kWh/m³ band.
Sensors and Online Analyzers You Actually Need
The KPI table only works if the underlying sensors exist, are calibrated, and stay on the maintenance schedule. A 50 MLD municipal plant in 2026 should expect to instrument roughly 12–16 online analyzers per major process train, with capex ranging from $180K to $450K depending on redundancy and whether nutrient (NH3-N, NO3-N, PO4) probes are added to the aeration basin.
At the headworks and primary effluent, the minimum kit is pH, conductivity, TSS or turbidity, temperature, and magnetic flow — typically Endress+Hauser Liquiline or Hach sondes on a multi-parameter platform. UV254-based COD/BOD proxies (Hach UVAS, s::can, Endress+Hauser UV) have matured enough in 2026 to replace 80% of grab-sample COD for trending, though they still need a monthly lab cross-check per ISO 15839. Inside the biological reactor, optical dissolved oxygen (LDO) probes have largely displaced galvanic membranes because they tolerate fouling better and recalibrate in air rather than requiring a sodium sulfite trip; ammonia ISE (ion-selective electrode) and UV nitrate probes cover nitrification control, while optical or ultrasonic MLSS meters replace the legacy optical-density correlation that drifted with sludge color.
Tertiary and reuse stages need a phosphate analyzer (molybdenum-blue colorimetric or, increasingly, UV no-reagent), residual chlorine, UV transmittance for disinfection dose control, and a particle counter for filter integrity. The 2026 maintenance reality is that optical DO and UV NO3 sensors need calibration every 2–4 weeks (per Endress+Hauser Memosens and Hach sc datasheets) versus the 1–2 week cadence older membrane probes still demand — a real labor saving once the platform stabilizes. For the biological side, pairing a high-quality DO probe with a well-characterized HydropureWater MBR membrane bioreactor system keeps KPI 4 and KPI 5 honest by holding MLSS within the 8,000–12,000 mg/L band that the aeration-energy formulas assume. For preliminary screening, the GX Series rotary mechanical bar screen with PLC I/O feeds a clean, PLC-readable flow signal into KPI 1.
2026 Platform Shortlist: From Ignition to Grafana
No single vendor owns this market end-to-end, and pretending otherwise wastes procurement time. The shortlist below splits platforms into three honest categories with 2026 cost bands for a representative 50 MLD plant.
| Category | Examples | 2026 CAPEX (50 MLD) | Annual Support | Best Fit |
|---|---|---|---|---|
| SCADA-first | Inductive Automation Ignition, AVEVA System Platform, Emerson iFIX | $60K–$250K | 15–18% | 5–500 MLD municipal, full OT/IT integration |
| BI-first (on top of historian) | Power BI, Grafana + InfluxDB/PostgreSQL, Tableau | $40K–$120K | 10–20% | Plants with historian in place, reporting-heavy use case |
| WWTP specialist | AquaVar, ARC, BlueField, Sigma, Trimble Unity | $80K–$400K | 15–20% | Compliance-driven utilities wanting pre-built reports |
Fit logic: under 5 MLD or for an industrial side-stream, Grafana + InfluxDB + Ignition Edge delivers ~80% of the value at under $30K CAPEX, and the open-source stack keeps the L4 dashboards free. From 5–50 MLD, Ignition by Inductive Automation is the default 2026 choice because the unlimited-tag licensing model eliminates per-point fees and the Perspective module handles the modern web HMI. Above 50 MLD with strict cybersecurity obligations (NERC-CIP-adjacent, American Water Infrastructure Act of 2018 risk assessments), AVEVA PI System with AVEVA Connect remains the most defensible option for long-term data retention and 5–10-year historian continuity.
The 2026 must-ask RFP question is "does your platform ship with AI-assisted alarm tuning as a standard module, and is it licensed per-tag or site-wide?" AVEVA PI, Ignition, and Grafana Cloud all now include anomaly-detection add-ons; the older SCADA vendors charge 30–50% of base list as a separate AI module. For protocol-level integration questions to put in the same RFP, the 2026 SCADA engineering guide for industrial wastewater plants lists the OPC UA and MQTT conformance tests worth requiring.
How to Roll Out a KPI Dashboard Without Disrupting Operations
Most failed dashboard projects do not fail at design — they fail in the first 8 weeks when operators lose trust because the numbers do not match the lab. A defensible 2026 rollout runs in four phases over 20 weeks, with a parallel-run gate between phase 2 and phase 3 that catches data-quality problems before they reach shift handovers.
- Phase 1 (weeks 1–4): data-source audit, sensor gap analysis, target KPI list signed off by operations. Deliverable is a tag-by-tag source-of-truth spreadsheet and a sensor capex list.
- Phase 2 (weeks 5–12): historian configuration, OPC UA connectivity, dashboards run in parallel against manual lab data for at least four weeks. The 24-h composite vs. online-probe delta for KPI 3 must be <10% before phase 3.
- Phase 3 (weeks 13–20): alarm-threshold tuning (start at 75% of permit, tighten after 30 days of stable operation), operator training, SOP updates that name the new alarms and the named owner for each.
- Phase 4 (ongoing): monthly KPI review with operations and compliance, quarterly sensor calibration audit tied to the maintenance plan, and an annual platform upgrade cycle aligned with the vendor's LTS release.
The single most common failure is deploying L4 BI dashboards before L0–L1 sensor hygiene is righted — turbidimeters that have not been cleaned in three months, DO probes with air-calibration intervals that exceed six months, flow meters with unconfirmed K-factor updates. Garbage-in, garbage-out remains the #1 cause of operator distrust, and once operators stop trusting the screen they stop reading the alarms. For an example of a process that benefits from this staged approach, the IFAS working principle and process design reference shows how the KPI 5 SOTE target ties back to the diffuser cleaning interval in the maintenance plan.
Frequently Asked Questions
What polling rate should a 2026 WWTP dashboard use?
1–10 seconds at L2 SCADA, 1-minute compression in the historian, and raw 100-ms capture for compliance points that feed EPA DMRs — these are the values the architecture section quantifies and the integration team should bake into the historian configuration.
Which KPIs should trigger an alarm at 75% of the regulatory limit?
Only the four effluent compliance KPIs — TSS, BOD, NH3-N, and total phosphorus — should be set at 75% of the NPDES or UWWTD permit limit, because they are the metrics that drive enforcement action. The other four KPIs in the table use baseline-relative thresholds, as detailed in the 8-KPI formula table.
How much historian storage does a 50,000-tag plant need?
Roughly 70 GB per year compressed at 1-minute averages, so a 5-year retention policy requires about 350 GB of disk — a number the architecture section derives and that fits comfortably on a single on-premise server. For phosphate-specific compliance work, the online phosphate analyzer engineering guide for WWTPs covers the analyzer-side retention considerations.
Related Equipment
- PLC-controlled automatic chemical dosing skid — specifications, capacity range, and technical data