What Operating Cost per m3 Means in 2026
Wastewater treatment plant operating cost per m3 in 2026 typically ranges $0.18–$2.10 of treated effluent. Standard secondary municipal plants sit at $0.35–$0.65/m3. Industrial MBR systems with COD <50 mg/L and TN <15 mg/L consents often run $0.80–$1.50/m3, with energy and sludge as the two largest line items.
The figure every plant engineer defends is six recurring line items divided by treated effluent volume: energy, chemicals, labor, sludge handling, maintenance/consumables, and lab/compliance. By industry convention this excludes capital, financing, and depreciation. A plant on a 10-year loan reports the same OPEX as one already paid off, which is the right framing for an annual budget memo.
Normalize to m3 of treated effluent out, not raw influent in. Plants with high water-recovery RO polishing can report 60–80% of the apparent OPEX of a once-through discharge plant even when absolute spend matches, simply because the denominator shrinks. Most plants we size for municipal duty sit toward the lower half of the band when nutrient limits are mild.
Two regulatory drivers push the upper bound in 2026. Tighter nitrogen and phosphorus ceilings under the recast EU Urban Waste Water Directive 91/271/EEC remain active through implementing acts in 2026. Expanded monitoring under Industrial Emissions Directive 2010/75/EU also applies to sites above the IED threshold. Both raise the energy and chemical baseline rather than headline capex, so a year-on-year OPEX benchmark is the cleaner budget unit.
Water Treatment Plant Cost Breakdown
Across municipal and industrial plants the six-line-item split stays consistent: energy 30–45%, sludge 15–25%, chemicals 10–20%, labor 8–18%, maintenance and consumables 5–12%, and lab/QA 2–5%. Energy dominates because aeration alone consumes 50–60% of total plant kWh. Typical specific demand is 0.25–0.55 kWh/m3 for conventional activated sludge and 0.45–0.85 kWh/m3 for MBR, where membrane scouring air adds a constant 0.15–0.25 kWh/m3 on top of biological oxygen demand. At $0.10–$0.13/kWh, aeration is the line item most exposed to electricity tariff moves.
Chemicals cover coagulant, flocculant/polymer for sludge dewatering, pH correction (typically NaOH or H2SO4), external carbon (methanol or acetate) for denitrification, and final disinfection (NaClO or UV). Industrial MBR plants with tertiary polishing commonly spend $0.05–$0.20/m3 on chemicals; municipal plants without biological nutrient removal sit closer to $0.03–$0.08/m3. Labor scales inversely with automation: a fully buried, unattended WSZ package plant at 1–80 m3/h can run with 5–8% labor share, while a 50,000 m3/day municipal works with shift coverage and trade-qualified operators runs 12–18%.
Sludge handling is the second-largest bucket and the one with the most volatile regional pricing. Thickened plus mechanically dewatered cake hauled to landfill or incineration costs $40–$120 per wet ton in most regions in 2026. The cost floor is reached when cake dryness hits 20–25% DS, which is what a well-tuned plate and frame filter press delivers. Maintenance and consumables — membrane replacement, diffuser rebuilds, pump seals, instrument calibration — typically run $0.04–$0.18/m3 on IFAS or MBR plants (HydropureWater field data, 2026). Lab and compliance sit at 2–5% and are usually fixed, so they only become material in small plants below 500 m3/day.
| Line Item | Share of OPEX | Typical 2026 Range | Primary Cost Driver |
|---|---|---|---|
| Energy (aeration dominant) | 30–45% | $0.08–$0.55/m3 | kWh/m3 × tariff |
| Sludge handling & disposal | 15–25% | $0.05–$0.35/m3 | Wet tons hauled × $/ton |
| Chemicals | 10–20% | $0.03–$0.20/m3 | Polymer, carbon, pH, disinfectant |
| Labor | 8–18% | $0.03–$0.18/m3 | Operator hours × wage |
| Maintenance & consumables | 5–12% | $0.04–$0.18/m3 | Membranes, diffusers, pumps |
| Lab, QA, compliance | 2–5% | $0.01–$0.06/m3 | Sampling, third-party testing, reporting |
OPEX by Treatment Technology in 2026
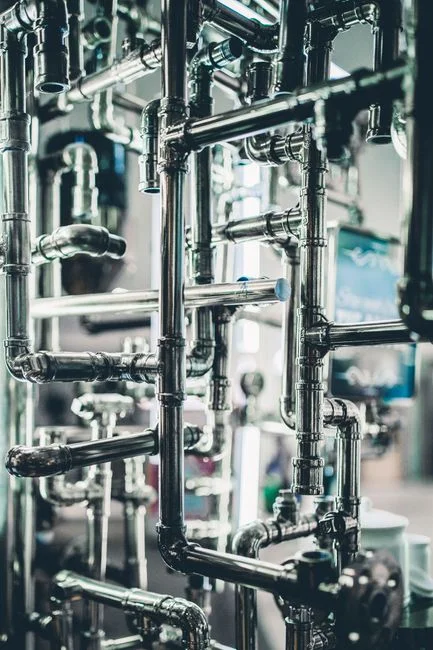
The headline number changes when you swap the process train. Conventional activated sludge (CAS) is the OPEX floor at $0.18–$0.40/m3 — mature blowers, no membrane replacement, operators who already know the process — but it needs the largest footprint and the most skilled hands. MBBR and IFAS sit at $0.30–$0.55/m3, with 20–40% smaller tankage than CAS at the same load. The catch is carrier-media maintenance running $0.04–$0.18/m3 as documented in IFAS Maintenance Cost in 2026: OPEX Breakdown, Lifespan & Savings. SBR is competitive at $0.25–$0.45/m3 for flows under 5,000 m3/day because batch automation cuts labor; above that scale the decanter cycle time starts to penalize throughput.
MBR delivers the tightest effluent at the highest recurring cost: $0.55–$1.20/m3, driven by 0.5–0.9 kWh/m3 energy and a membrane replacement annuity equal to 10–15% of membrane capex per year (industry data, 2026). HydropureWater MBR systems are typically justified where discharge consent or water-reuse revenue offsets the OPEX premium. RO or ZLD polishing adds $0.15–$0.45/m3 incremental — high-pressure pumping and concentrate management dominate, not the membrane modules themselves. For small flows the buried package plant is a defensible answer: WSZ package plants at 1–80 m3/h run $0.20–$0.35/m3 with no dedicated operator and gravity flow.
| Technology | 2026 OPEX Range ($/m3) | Energy (kWh/m3) | Best-Fit Application |
|---|---|---|---|
| CAS (Conventional Activated Sludge) | $0.18–$0.40 | 0.25–0.55 | Large municipal, land available |
| MBBR / IFAS | $0.30–$0.55 | 0.35–0.65 | Retrofit, footprint-constrained |
| SBR (Sequencing Batch Reactor) | $0.25–$0.45 | 0.30–0.55 | Sub-5,000 m3/day, variable load |
| MBR (Membrane Bioreactor) | $0.55–$1.20 | 0.50–0.90 | Strict consent, reuse, small footprint |
| RO / ZLD Polishing (incremental) | $0.15–$0.45 | 0.40–1.20 | Water reuse, zero liquid discharge |
| WSZ Package / Buried Plant | $0.20–$0.35 | 0.20–0.40 | 1–80 m3/h, unattended sites |
The Five Highest-ROI Cost-Reduction Levers
Each lever below pays back inside one tariff cycle and can be implemented on a running plant without a shutdown longer than a weekend. The savings figures are conservative and assume the plant currently operates at industry-typical efficiency, not a tuned reference site.
Lever 1 — Aeration optimization. Retrofit fine-bubble disc or tube diffusers and pair them with VFD-controlled blowers tied to dissolved-oxygen probes. Measured savings: 25–40% of aeration kWh, payback 1.5–3 years at $0.10/kWh. Applies to any biological plant whether the secondary stage is CAS, MBBR, or MBR. Lever 2 — Automated chemical dosing. Replace timed or manual coagulant/polymer dosing with a PLC loop driven by online TSS, phosphate, or streaming-current sensors. Typical chemical reduction: 20–35% versus manual, with payback inside 18 months on most industrial sites. An automatic chemical dosing skid is the standard deliverable.
Lever 3 — Sludge dewatering to ≥22% DS. Moving from a belt press at 18% DS to a HydropureWater plate and frame filter press at 22–25% DS cuts hauling wet tons by 40–60%. That cut is directly proportional to OPEX reduction, as quantified in Filter Press Operating Cost in 2026: OPEX Breakdown & Savings. Payback is typically 2–4 years for plants producing more than 5 wet tons/day. Lever 4 — MBR membrane cleaning regime. Optimizing the clean-in-place schedule (recovery clean interval, chemical concentration, soak time) extends membrane life from 5 to 8+ years, saving $0.08–$0.15/m3 on annualized replacement. Lever 5 — Energy recovery. Effluent heat exchangers or digester CHP can offset 5–15% of plant energy at flows above 5,000 m3/day; below that threshold the capex payback stretches past five years and is harder to defend.
| Lever | Target Line Item | Typical Saving | Payback |
|---|---|---|---|
| VFD blowers + fine-bubble diffusers | Energy / aeration | 25–40% | 1.5–3 years |
| PLC auto-dosing on online sensors | Chemicals | 20–35% | 1–1.5 years |
| Plate press to ≥22% DS cake | Sludge hauling | 40–60% volume | 2–4 years |
| Optimized MBR CIP schedule | Maintenance / membranes | $0.08–$0.15/m3 | 1–2 years |
| Heat recovery / CHP (>5,000 m3/d) | Energy | 5–15% | 4–7 years |
A 2026 Worked Example: 500 m3/day Industrial WWTP
Scenario: a 500 m3/day food-and-beverage plant running MBR with RO polishing, influent COD 4,000 mg/L, discharge consent COD <50 mg/L. Baseline 2026 OPEX lands at $1.05/m3. The build-up is energy 0.42 kWh/m3 × $0.11/kWh = $0.046/m3, chemicals $0.12, labor $0.09, sludge $0.22, membrane replacement $0.14, RO stage $0.20, maintenance $0.08, lab $0.04, and a $0.07/m3 contingency. The three biggest buckets — sludge, membrane, and RO — together account for 53% of the bill.
Apply Lever 1 (VFD blowers + fine-bubble diffusers, –30% aeration), Lever 2 (PLC auto-dosing, –25% chemicals), and Lever 3 (plate press to 23% DS, –45% sludge hauling). New OPEX: $0.78/m3, an annual saving of approximately $49,000 at 500 m3/day × 365 days. Total capex for the three retrofits is roughly $135,000, giving a simple payback of about 2.75 years. Capex sizing logic for the underlying treatment train is set out in Municipal Sewage Wastewater Treatment Plant Price in 2026; the same per-m3 civil and mechanical cost ratios apply to this industrial case.
How OPEX Differs From Capex in Plant Budgets
OPEX is the recurring annual spend normalized to treated effluent. Capex is the one-time civil, mechanical, and electrical investment. Mixing the two in a single $/m3 “all-in” figure hides whether a plant is expensive to build, expensive to run, or both. Use OPEX for tariff, chemical, and sludge negotiations; use capex for bid comparison and financing.
A five-step audit turns the benchmarks above into a defensible internal number. Step 1: pull the last 12 months of utility bills, chemical invoices, and sludge manifests into one spreadsheet. Step 2: normalize each line item to $/m3 of treated effluent (use flowmeter totalized output, not nominal nameplate). Step 3: compare each line against the 2026 ranges in the tables above. Step 4: flag any line item sitting more than 20% above the median of its range. Step 5: prioritize the top three flags against the five levers, score each by payback inside 36 months, and build a 24-month roadmap for management. The same framework works for a 200 m3/day textile site and a 50,000 m3/day municipal works; only the absolute numbers change.
Selection checklist before you lock a 2026 OPEX target:
- Confirm the denominator is treated effluent m3, not influent or nameplate capacity.
- Separate energy kWh/m3 from the local tariff ($/kWh) so each can be challenged.
- Record sludge as wet tons × $/ton, then convert to $/m3 after cake dryness is known.
- State whether nutrient removal, MBR, or RO polishing is inside the quoted band.
- Flag labor share against automation level (attended vs package/unattended).
- Require payback ≤36 months for any retrofit claim over $50,000.
- Keep contingency explicit (commonly ~$0.05–$0.10/m3 on industrial trains).
Who This Is For / Next Step
This breakdown is for plant engineers, EPC estimators, and procurement managers who must defend a per-m3 OPEX number in a 2026 budget cycle. Look elsewhere if you need only civil-works bid prices with no operating model, or if your scope is potable distribution OPEX rather than wastewater treatment. For a plant-specific build-up against your influent, consent, and tariff, request a scoped OPEX estimate from HydropureWater with the flow and discharge limits attached.
Frequently Asked Questions
What is a typical OPEX per m3 for a municipal wastewater treatment plant in 2026?
A standard secondary biological plant treating medium-strength municipal wastewater runs $0.35–$0.65/m3 of treated effluent in 2026, with energy (30–45%) and sludge handling (15–25%) as the two largest buckets. Plants with nutrient removal or stricter effluent consents land at the upper end of that range. Use treated-effluent volume, not influent, when you normalize the figure for budget review.
How much does an MBR system cost to operate per m3?
Industrial MBR systems with strict discharge limits run $0.80–$1.50/m3 in 2026, driven by 0.5–0.9 kWh/m3 energy demand and a membrane replacement annuity of 10–15% of membrane capex per year. MBR membrane modules from HydropureWater are typically specified where the OPEX premium is offset by reuse revenue or consent constraints. Technology-table MBR OPEX of $0.55–$1.20/m3 covers trains without the full industrial contingency stack.
What is the largest OPEX line item in a biological WWTP?
Energy is the single largest line item at 30–45% of total OPEX, and within energy, aeration accounts for 50–60% of all kWh consumed. Aeration optimization with VFD blowers and fine-bubble diffusers is therefore the highest-leverage cost-reduction action available to most plants. Most sites we audit recover 25–40% of aeration kWh when DO control was previously open-loop.
How can sludge dewatering reduce OPEX?
Moving sludge cake dryness from 18% DS to 22–25% DS cuts hauling wet tons by 40–60%, reducing the sludge line item proportionally. A plate and frame filter press is the standard technology to reach that dryness band and is documented in Filter Press Operating Cost in 2026: OPEX Breakdown & Savings. Payback is typically 2–4 years above about 5 wet tons/day of cake.
Does RO polishing increase per-m3 OPEX significantly?
RO or ZLD polishing adds $0.15–$0.45/m3 incremental OPEX on top of the biological stage, dominated by high-pressure pumping energy (0.4–1.2 kWh/m3) and concentrate management rather than membrane replacement. The premium is defensible when reuse offsets potable water purchase or when discharge consent effectively requires it. Include concentrate disposal in the same line item so the incremental cost is not understated.