What CASS Is and How It Differs from SBR and CAST
The Cyclic Activated Sludge System (CASS) is a patented variant of the sequencing batch reactor family developed by Aqua-Aerobic Systems in the late 1980s, and it operates on a continuous fill-and-decant cycle rather than the strict batch fill-react-settle-draw sequence of a classical SBR. CASS, SBR, and CAST all share the same temporal-reactor DNA — biological reactions occur in time rather than in space — but the three acronyms cause more procurement confusion than almost any other grouping in biological wastewater treatment OPEX evaluations. CASS uses a pre-react selector zone with continuous influent feed to control filamentous bulking; SBR is true batch with all four phases isolated; CAST is a newer Aqua-Aerobic hybrid that adds a biological phosphorus removal stage.
A standard CASS cycle runs 4–6 hours, with the react phase consuming roughly 60% of the cycle, settle 15%, decant 10%, and idle 15%. Typical design parameters fall in narrow bands: MLSS of 3,000–5,000 mg/L, HRT of 18–30 hours, SRT of 10–25 days, and an F:M ratio of 0.05–0.15 kg BOD/kg MLSS·d. These ranges are not arbitrary — they hold the system inside the simultaneous nitrification-denitrification window where CASS achieves its low observed sludge yield of 0.3–0.5 kg TSS/kg BOD removed. The selector zone is the single feature that distinguishes CASS from generic SBR, and it is the reason CASS plants can sustain the MLSS and F:M values above without the clarifier upsets that plague conventional basins.
2026 CASS Operating Cost Benchmark: What to Expect Per Cubic Meter
CASS process operating cost in 2026 typically falls between $0.18 and $0.55 per cubic meter of treated wastewater, with aeration energy alone accounting for 50–60% of total OPEX. Sludge handling adds another 15–20%, and chemicals plus maintenance make up the remainder. CASS achieves this low band because its batch operation enables simultaneous nitrification-denitrification, cutting both blower runtime and sludge yield to 0.3–0.5 kg TSS/kg BOD removed — well below conventional activated sludge.
The headline range carries explicit assumptions: influent BOD 150–400 mg/L, design flow 1,000–50,000 m³/d, electricity tariff $0.08–$0.14/kWh, and a mid-cost labor region. Step outside any of these and the band widens. Plants below 5,000 m³/d run $0.35–$0.55/m³ because labor is not diluted across flow; mid-size plants of 5,000–20,000 m³/d run $0.22–$0.38/m³; large municipal installations above 20,000 m³/d reach $0.18–$0.28/m³, where the curve is dominated by aeration efficiency. Compared to MBR, which runs $0.35–$0.85/m³, CASS saves $0.15–$0.30/m³ in typical 2026 conditions. Compared to conventional activated sludge at $0.20–$0.45/m³, CASS sits at parity for small plants and 10–20% lower at large scale. A 1¢/kWh swing in electricity shifts aeration cost alone by $0.03–$0.05/m³ in a 5,000 m³/d plant, so tariff assumption is the single largest sensitivity in the model.
| Plant Size Tier | Design Flow (m³/d) | 2026 OPEX Range ($/m³) | Primary Cost Driver |
|---|---|---|---|
| Small | < 5,000 | 0.35 – 0.55 | Labor dilution |
| Mid-size | 5,000 – 20,000 | 0.22 – 0.38 | Aeration energy |
| Large municipal | > 20,000 | 0.18 – 0.28 | Aeration + sludge logistics |
| Reference: MBR | Any | 0.35 – 0.85 | Membrane aeration & cleaning |
| Reference: CAS | Any | 0.20 – 0.45 | Clarifier + RAS pumping |
Where the Money Goes: OPEX Component Breakdown for a CASS Plant
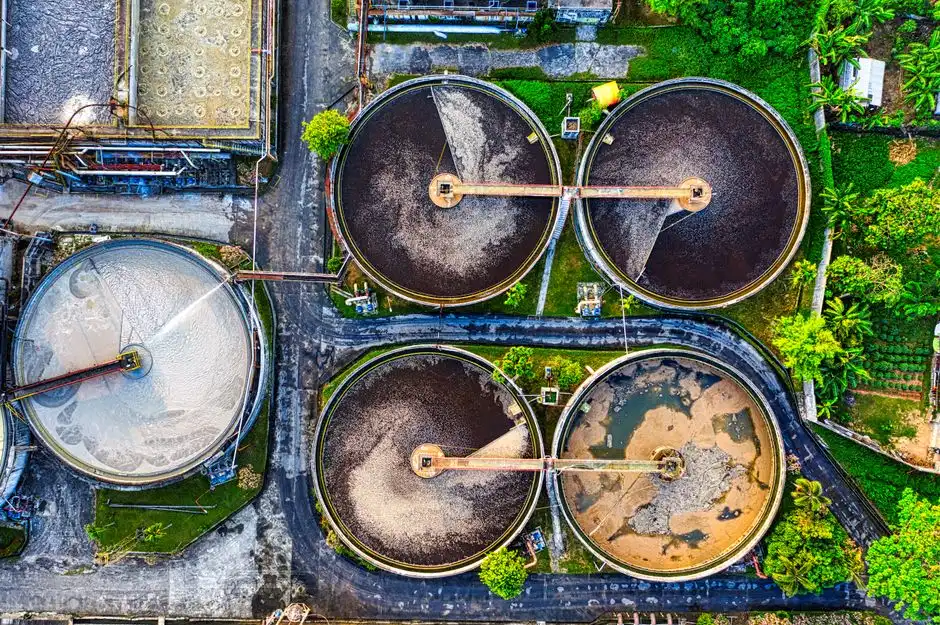
Aeration is the largest single line item in any CASS OPEX model, and it is the line item that responds most directly to instrumentation upgrades. A working benchmark uses 1.8–2.5 kWh/kg BOD removed at 90% BOD removal with influent of 250 mg/L, which produces approximately 0.40 kWh/m³ of aeration electricity. At a $0.10/kWh tariff that translates to $0.04/m³ for blower power alone, and that figure then scales to the 50–60% share of total OPEX that is observed across the HydropureWater field data set in 2026. Sludge handling ranks second, with an observed yield (Y_obs) of 0.4 kg TSS/kg BOD and the same 90% removal producing roughly 90 g TSS per cubic meter treated. Thickening and dewatering to 20% dry solids at a typical $40/tonne wet cost yields about $0.018/m³ for the dewatering step alone, and hauling adds $0.01–$0.04/m³ depending on transport distance. The downstream dewatering train is usually built around a plate and frame filter press on CASS plants above 5,000 m³/d, and the press selection directly drives that $0.018/m³ figure.
Labor runs 0.5–1.5 operator-hours per 1,000 m³ treated for an automated CASS configuration with online probes, which is one of the structural OPEX advantages over CAS. At $25/h fully loaded, labor lands at $0.013–$0.038/m³. Chemicals split into three sub-categories: methanol or acetate for denitrification carbon at $0.005–$0.020/m³ where influent C:N is unfavorable; polymer for sludge dewatering at $0.003–$0.010/m³; and phosphate precipitation chemicals at $0.002–$0.008/m³ when biological P removal cannot meet the limit. Maintenance is typically 3–5% of CAPEX per year and covers pump and blower rebuilds, diffuser replacement, decanter seals, and instrumentation calibration.
| Cost Component | Share of OPEX | Typical $/m³ Band | Primary Lever |
|---|---|---|---|
| Aeration energy | 50 – 60% | 0.10 – 0.20 | DO control, VFD, diffuser age |
| Sludge handling | 15 – 20% | 0.03 – 0.08 | Dewatering DS%, hauling distance |
| Labor | 8 – 12% | 0.013 – 0.04 | Automation, cycle tuning |
| Chemicals | 5 – 8% | 0.01 – 0.04 | Carbon source, polymer dose |
| Maintenance & consumables | 5 – 10% | 0.01 – 0.03 | Blower service, diffuser swap |
CASS vs SBR vs MBR vs Conventional Activated Sludge: OPEX Comparison
The technology choice has a larger effect on OPEX than almost any other decision a buyer can make after the influent characterization is fixed. MBR commands a $0.15–$0.30/m³ premium over CASS, and that premium is paid almost entirely in membrane aeration and chemical cleaning — typically CIP every 1–3 months plus periodic recovery cleans. MBR is justified only when the discharge or reuse limit is below 1 mg/L TSS, or when the project is space-constrained and the smaller MBR basin footprint is worth the OPEX penalty. Conventional activated sludge runs roughly equal to CASS at small scale because labor dominates, but CASS pulls 10–20% ahead at large scale because it eliminates the separate clarifier, the return activated sludge pumping, and the waste activated sludge control loop. SBR lands very close to CASS on OPEX, with the gap explained mainly by whether the project uses the Aqua-Aerobic selector and whether biological P removal is required.
| Metric | CASS | SBR | MBR | CAS |
|---|---|---|---|---|
| 2026 OPEX ($/m³) | 0.18 – 0.55 | 0.20 – 0.55 | 0.35 – 0.85 | 0.20 – 0.45 |
| Energy (kWh/m³) | 0.35 – 0.50 | 0.38 – 0.55 | 0.60 – 1.10 | 0.30 – 0.50 |
| Sludge yield (kg TSS/kg BOD) | 0.30 – 0.50 | 0.35 – 0.55 | 0.30 – 0.50 | 0.40 – 0.70 |
| Footprint | Medium | Medium | Small | Large |
| Operator skill required | Moderate | Moderate | High | Low |
Decision rule for procurement: choose CASS over MBR when the discharge limit is ≤30 mg/L BOD and ≤30 mg/L TSS — the band that covers the vast majority of municipal and food-and-beverage discharges. Choose MBR only when reuse-quality effluent is required or when total phosphorus below 0.5 mg/L is mandatory without chemical polishing.
Seven Proven Ways to Cut CASS Operating Cost in 2026
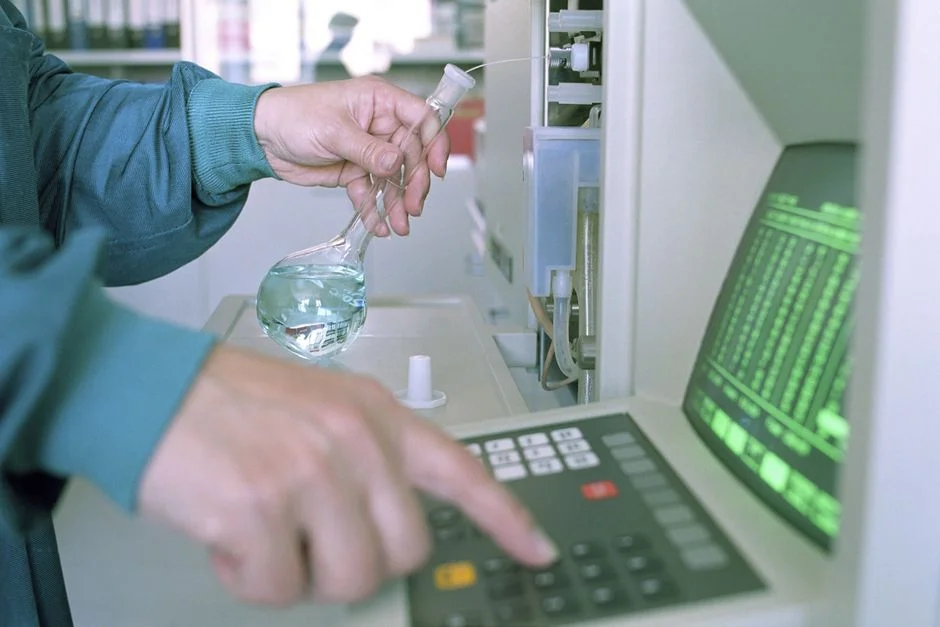
The fastest savings on a CASS plant come from instruments, not capital projects. A DO probe on each basin paired with a VFD-controlled blower and a setpoint of 0.5–2.0 mg/L typically saves $0.02–$0.06/m³ with a 12–24 month payback, because most CASS plants run the blower on a fixed-speed profile that over-aerates during the settle and idle phases. Replacing fine-bubble diffusers every 5–7 years rather than running them to failure at 10–15 years saves $0.015–$0.04/m³ and pays back in under 18 months, because oxygen transfer efficiency drops from ~30% SOTE to under 18% SOTE as diffusers foul, and the blower burns the same kilowatt-hours to deliver less usable oxygen. Optimizing the selector zone to enhance biological P removal cuts chemical precipitation OPEX by $0.01–$0.03/m³ by suppressing the metal-salt dose that otherwise carries the limit.
Switching from methanol to internal carbon source — typically a controlled bypass of raw wastewater during the react phase — saves $0.01–$0.04/m³ at plants where methanol is dosed year-round. Lowering SRT operation to 5–8 days, or adding thermal hydrolysis upstream of dewatering, cuts wet sludge mass and drops hauling OPEX by $0.01–$0.05/m³. SCADA-based cycle optimization that matches react time to actual BOD load saves another 5–10% on energy, translating to $0.01–$0.03/m³ with a payback under 12 months. Co-digestion of external high-strength waste such as FOG or food-processing concentrate can net $0.02–$0.08/m³ once tipping fees are credited against aeration, but this lever requires a digester CAPEX line and is only viable for plants above 10,000 m³/d.
| Lever | Savings ($/m³) | Payback | CAPEX Required |
|---|---|---|---|
| DO control + VFD blower | 0.02 – 0.06 | 12 – 24 mo | Low |
| Diffuser replacement (5–7 yr) | 0.015 – 0.04 | < 18 mo | Low |
| Selector zone P optimization | 0.01 – 0.03 | 6 – 12 mo | None |
| Internal carbon (raw BOD bypass) | 0.01 – 0.04 | < 6 mo | Piping |
| Sludge minimization (SRT, THP) | 0.01 – 0.05 | 18 – 36 mo | Medium |
| SCADA cycle optimization | 0.01 – 0.03 | < 12 mo | Low |
| Co-digestion of FOG / food waste | 0.02 – 0.08 net | 24 – 60 mo | High |
Most plants will recoup 30–50% of their total OPEX in the first 18 months by stacking levers 1, 2, and 6 without any new CAPEX, and that same combination can be instrumented using an automatic chemical dosing system for the precipitation and polymer lines that close the loop.
How to Model CASS OPEX for a Capex Decision in 2026
The simplest defensible model fits on one Excel row:
OPEX/m³ = (Energy_kWh × $/kWh + Sludge_kg × $/tonne + Labor_h × $/h + Chemicals_kg × $/kg + Maintenance_$/yr) ÷ Flow_m³
Worked example for a 10,000 m³/d plant with influent BOD of 200 mg/L, 90% removal, electricity at $0.10/kWh, and 2.0 kWh/kg BOD: base energy lands at $0.20/m³. Add sludge at $0.04/m³, labor at $0.025/m³, chemicals at $0.015/m³, and maintenance at $0.02/m³, and the model returns $0.30/m³ — within the mid-tier band of the 2026 benchmark. Three errors repeat themselves across most vendor models: cycle idle time is forgotten (which overstates asset utilization), design influent is used in place of actual (which overstates OPEX), and peak-flow dilution is ignored (which understates the aeration worst case). Treat the model output as a midpoint and apply a ±25% sensitivity band before presenting it to finance, with electricity tariff and sludge hauling distance as the two variables that swing the result most. A useful cross-check is the filter press OPEX article for the dewatering train, since the press alone can move the sludge line by $0.01/m³ depending on cake dryness.
Frequently Asked Questions About CASS Process Operating Cost
What is the average operating cost of a CASS wastewater treatment plant in 2026? The 2026 band is $0.18–$0.55/m³, with small plants under 5,000 m³/d at the high end ($0.35–$0.55), mid-size at $0.22–$0.38, and large municipal above 20,000 m³/d at $0.18–$0.28.
Is CASS cheaper than MBR to operate? Yes — by $0.15–$0.30/m³ in 2026, because MBR carries membrane aeration, periodic CIP, and membrane replacement reserves. MBR is only justified for reuse-quality or sub-1 mg/L TSS limits.
How much electricity does a CASS plant use per cubic meter? Typical 2026 plants run 0.35–0.50 kWh/m³, which translates to $0.035–$0.07/m³ at a $0.10/kWh tariff — about half of total OPEX.
What is the sludge production rate of CASS? The observed yield is 0.3–0.5 kg TSS/kg BOD removed, which on a 250 mg/L BOD influent at 90% removal produces roughly 90 g TSS per cubic meter treated, or 0.09 wet tonnes at 20% DS per 1,000 m³.
How long is the payback on CASS vs conventional activated sludge? At a typical 10,000 m³/d scale and a 15% discount rate, the OPEX delta alone delivers a 4–7 year payback against CAS, before counting the smaller CASS footprint and the avoided clarifier CAPEX. For a deeper cross-technology comparison, the forward osmosis maintenance cost breakdown covers the high-reuse end of the spectrum that CASS typically does not address.