Why the WuXi AppTec CDMO Expansion Forces a New ETP
WuXi AppTec's 2025 capital expenditure of RMB5.5–6.0B (per Q3 2025 disclosure) funds reactor trains, oligonucleotide capacity, biologics suites, and the U.S. Delaware CDMO campus expected operational by end-2025 with further expansion in 2027 (Fierce/Fortune, 2025-11). Translated into hydraulic load, the China sites and Delaware together imply a combined effluent envelope of 5,000–15,000 m³/day once commercial production reaches steady state — well above what any existing on-site treatment asset at the legacy Shanghai or Wuxi parks was designed for. The Q3 2025 Continuing Operations backlog of RMB59.9B confirms that this capacity is committed to revenue, not speculative.
The wastewater fingerprint of an API-bearing CDMO differs from a pure-play generics plant. A typical CRDMO effluent shows COD 5,000–25,000 mg/L, BOD/COD ratio 0.25–0.40, TSS 200–1,500 mg/L, total nitrogen 50–300 mg/L, conductivity 5–25 mS/cm, and API-active residues measurable in the µg/L range (HydropureWater field data, 2026). A single train cannot serve both jurisdictions: Shanghai/Wuxi sites discharge under China GB 21904-2008 and GB 8978-1996 to municipal sewers or surface water, while Delaware discharges under U.S. EPA 40 CFR Part 439 via an NPDES permit to the receiving stream. Equipment must be specified against the tighter of the two envelopes.
| Driver | Source | Engineering implication |
|---|---|---|
| 2025 capex RMB5.5–6.0B | WuXi Q3 2025 outlook (2025-10) | New reactor trains, labs, CIP skids → +3,000–8,000 m³/day |
| Delaware campus online end-2025 | Fierce/Fortune (2025-11) | New 1,500–4,000 m³/day stream under 40 CFR Part 439 |
| 2027 Delaware expansion | Fierce/Fortune (2025-11) | EPC must deliver 14–20 months from FID |
| Q3 2025 backlog RMB59.9B | WuXi Q3 2025 disclosure | Capacity is committed, not speculative |
| STA oligonucleotide plant (Jan 2025) | C&EN (2025-01) | Adds DNA/RNA fragments and protein residues |
Influent Characterization for an API-Bearing CDMO Effluent
Five process streams converge on the ETP headworks, and each contributes a distinct pollutant signature. Reactor condenser blowdown delivers the highest COD load — typically 15,000–30,000 mg/L — together with solvent azeotropes and unreacted starting materials. Lab and glassware wash water adds lower-volume but API-diverse contamination, including cytotoxics, hormones, and antibiotics at µg/L to low-mg/L levels. Equipment CIP streams swing pH from 1 to 13 and contribute the bulk of the total dissolved solids load (NaCl, Na₂SO₄ from quench steps). Solvent-water separation decant carries emulsified halogenated solvents — dichloromethane, chloroform, acetonitrile — at 0.1–2% v/v. Scrubber blowdown adds acid gases absorbed into caustic, typically pH 9–13 with high sulfate.
WuXi AppTec's CRDMO scope adds two waste classes that older generic-API plants rarely see. The STA oligonucleotide plant opened January 2025 (C&EN) contributes short DNA/RNA fragments and process-related proteins, which behave as slowly biodegradable COD and foul MBR membranes if not pre-oxidized. Biologics suites add Protein A leachate, host-cell proteins, and high-conductivity buffer waste. Variability is severe: diurnal COD swings of 2–5× are common when batch reactors dump in sequence, and pH can step from 2 to 12 inside a single shift. This is why equalization basin sizing — typically 12–24 h HRT — is the first engineering decision, not an afterthought.
| Stream | Typical COD (mg/L) | Key pollutants | Variability |
|---|---|---|---|
| Reactor condenser blowdown | 15,000–30,000 | Refractory organics, residual solvents, APIs | Batch-driven, 3–5× swings |
| Lab / glassware wash | 2,000–8,000 | Cytotoxics, hormones, antibiotics (µg/L) | Daily, compound-specific |
| Equipment CIP | 1,500–6,000 | NaOH, H₃PO₄, NaCl, Na₂SO₄ | pH 1–13, 4–6× swings |
| Solvent decant | 5,000–15,000 | DCM, chloroform, acetonitrile (0.1–2% v/v) | Slug loads on phase break |
| Scrubber blowdown | 500–2,000 | SO₄²⁻, Cl⁻, Na⁺, pH 9–13 | Continuous, low swing |
ETP Process Train: Equalization to RO Polish
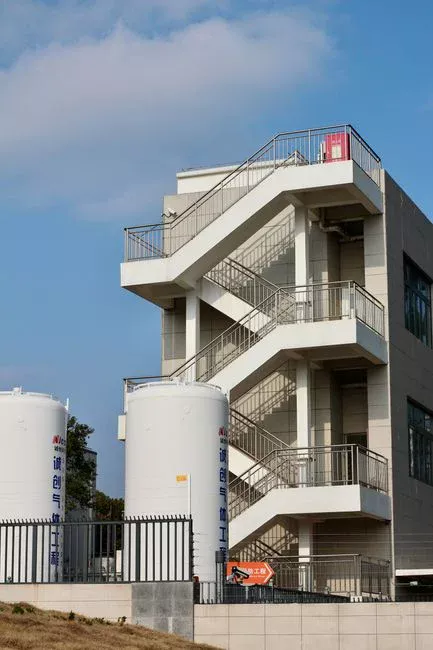
A defensible 2026 train for an API-bearing CDMO effluent runs in six steps. Each step targets a specific pollutant class, and the train is sized to meet the tighter of the Chinese and U.S. envelopes at all times.
Step 1 — Flow & load equalization. A 12–24 h HRT basin, typically split into a high-COD cell and a low-COD cell, with pH correction to 6.5–8.5 before biological treatment. The split lets operators route solvent slug loads through the Fenton/Ozone train independently from steady sanitary flow. A PLC-controlled chemical dosing skid handles acid, caustic, and antifoam feed.
Step 2 — Coagulation / DAF pre-treatment. A DAF pre-treatment unit removes 50–80% of TSS and emulsified solvent at an air-to-solid ratio of 0.005–0.020 and polymer dose 1–10 mg/L. DAF protects the downstream MBR from oil and solvent fouling — a frequent cause of premature membrane replacement in pharma ETP retrofits.
Step 3 — Advanced oxidation. Fenton (Fe²⁺/H₂O₂ at pH 2.5–3.5) handles refractory COD, while ozone (1–5 mg O₃/mg COD) is preferred when the goal is API-active residue destruction. Either path delivers 60–90% COD reduction and ≥3-log reduction of most APIs, including macrolides and several hormone-active compounds. Fenton sludge (iron hydroxide) goes to the plate press; ozone off-gas goes to a thermal destruct unit.
Step 4 — MBR. An integrated MBR system with PVDF flat-sheet or hollow-fibre membranes at 0.1 µm pore size, mixed liquor 8,000–12,000 mg/L MLSS, HRT 6–10 h, SRT 30–60 d. The MBR membrane module delivers COD ≤ 500 mg/L and TSS ≤ 5 mg/L to the RO feed. For a deeper comparison of MBR against moving-bed alternatives, see the MBR vs MBBR comparison.
Step 5 — Brackish RO polish. A brackish-water RO polish at 70–80% recovery sends concentrate to salt recovery or evaporation and permeate to cooling-tower makeup. For nitrogen-sensitive receiving streams, see the total nitrogen discharge limits guide.
Step 6 — Sludge handling. Waste activated sludge is thickened to 2–4% DS, then dewatered with a plate-and-frame filter press to 20–25% DS for off-site incineration. When the site handles PE-funded due diligence, the ETP due diligence questions checklist is the right starting framework.
| Step | Unit operation | Design parameter | Output |
|---|---|---|---|
| 1 | Equalization basin | 12–24 h HRT, pH 6.5–8.5 | Stable feed |
| 2 | DAF | A/S 0.005–0.020, polymer 1–10 mg/L | TSS −50–80% |
| 3 | Fenton / O₃ | 1–5 mg O₃/mg COD or Fe²⁺/H₂O₂ pH 2.5–3.5 | COD −60–90%, API ≥3-log |
| 4 | MBR | 0.1 µm PVDF, MLSS 8,000–12,000, HRT 6–10 h | COD ≤ 500, TSS ≤ 5 mg/L |
| 5 | Brackish RO | 70–80% recovery | Permeate to reuse, concentrate to salt recovery |
| 6 | Plate press | 20–25% DS output | Cake to incineration |
Effluent Compliance: China GB vs. U.S. 40 CFR Part 439
The two jurisdictions impose materially different envelopes, and the ETP must be designed against the tighter limit on every parameter. The China sites discharge under GB 21904-2008 (Class A, the standard developed specifically for API manufacturing) and GB 8978-1996 Table 4 for trace metals and halogenated solvents. The Delaware campus discharges under U.S. EPA 40 CFR Part 439 (Pharmaceutical Manufacturing Point Source Category), which sets Best Available Technology (BAT) effluent limits.
The numeric gaps matter. GB 21904-2008 Class A allows COD ≤ 500 mg/L and total nitrogen ≤ 70 mg/L; 40 CFR Part 439 sets COD daily max at 469 mg/L and ammonia-N at 30 mg/L (per EPA effluent guidelines). The U.S. ammonia-N limit is therefore the binding design constraint. NPDES permits also add site-specific limits for the receiving stream — typically the Delaware River basin, where chronic toxicity and whole-effluent toxicity (WET) testing are increasingly enforced. For a multi-API CRDMO, a defensible 2026 practice is to add a side-stream GAC or PAC polishing step for cytotoxics, antibiotics, and hormone-active compounds even where the numeric limit is not yet codified — the WHO and EU watch-list trajectory points in that direction.
| Parameter | China GB 21904-2008 Class A | U.S. 40 CFR Part 439 (BAT daily max) | Binding limit |
|---|---|---|---|
| COD | ≤ 500 mg/L | 469 mg/L | U.S. |
| Ammonia-N | ≤ 45 mg/L | 30 mg/L | U.S. |
| Total nitrogen | ≤ 70 mg/L | Site-specific NPDES | Site-specific |
| Total phosphorus | ≤ 8 mg/L | Site-specific NPDES | China |
| SS | ≤ 400 mg/L | 260 mg/L | U.S. |
| pH | 6–9 | 6–9 | Equal |
| Halogenated solvents | GB 8978-1996 Table 4 | Priority pollutants | Site-specific |
CAPEX and OPEX Benchmarks for a 2026 Pharmaceutical ETP
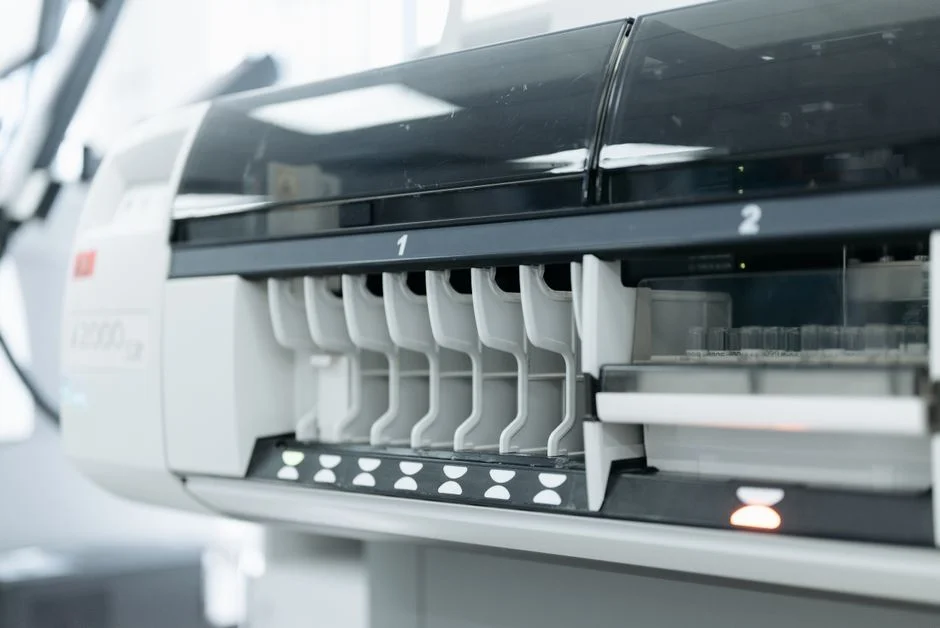
The 2026 cost envelope for a 5,000–15,000 m³/day pharma ETP is well-defined, and it scales sub-linearly with flow because equalization, MBR, and RO packages dominate the cost. The MBR + RO package alone typically accounts for 45–55% of total equipment cost, civil works 20–25%, and instrumentation/automation 10–15% (HydropureWater field data, 2026).
OPEX is dominated by electrical and membrane replacement. A combined MBR + RO train draws 0.8–1.6 kWh/m³, and UF/RO membranes are typically replaced on a 5–8 year cycle. Total OPEX lands at USD 0.55–1.20 per m³ treated. The reuse case is strong: 60–80% RO permeate reuse as cooling-tower makeup offsets USD 0.40–0.70/m³ in raw-water cost, and a 10,000 m³/day plant typically reaches payback in 4–6 years. EPC delivery for a CDMO ETP is 14–20 months from FID — which fits the 2027 Delaware expansion window if the engineering cycle starts in Q1 2026.
| Plant size | 2026 CAPEX envelope (USD) | MBR + RO share | OPEX (USD/m³) | Payback (reuse case) |
|---|---|---|---|---|
| 5,000 m³/day | 18–25M | 45–55% | 0.55–1.20 | 5–6 yr |
| 10,000 m³/day | 28–35M | 45–55% | 0.55–1.20 | 4–5 yr |
| 15,000 m³/day | 38–45M | 45–55% | 0.55–1.20 | 4–6 yr |
Equipment Selection and Implementation Checklist
For a 2026 multi-site CDMO ETP, specify equipment ranges that cover the full 5,000–15,000 m³/day envelope without resizing: DAF in the 4–300 m³/h range across 13 standard models; MBR systems rated 10–2,000 m³/day; RO targeting 95% recovery; and a PLC-controlled chemical dosing skid sized for coagulant, flocculant, and pH adjustment. Include a rotary bar screen at the headworks, a high-efficiency sedimentation tank for primary clarification, and a multi-media filter as an MBR feed polish. Insist on PLC automation with remote monitoring — the architecture is detailed in the remote monitoring architecture guide. When the feed carries a novel API or a new modality, run a 5–10 m³/day pilot skid for 60–90 days before full-scale procurement.
Frequently Asked Questions
What size ETP does the WuXi AppTec CDMO expansion need? A dual-train facility rated 5,000–15,000 m³/day — the China cluster plus the Delaware campus, sized for 2027–2028 steady-state production.
Which standard governs Delaware discharge — GB or U.S. EPA? U.S. EPA 40 CFR Part 439 (Pharmaceutical Manufacturing), with site-specific NPDES permit limits layered on top. The U.S. ammonia-N limit (30 mg/L daily max) is the typical binding constraint.
Why is Fenton or ozone oxidation necessary for a CDMO effluent? Refractory COD and API-active residues (cytotoxics, hormones, antibiotics) are not removed by biological treatment alone; advanced oxidation delivers 60–90% COD reduction and ≥3-log API destruction.
What is the 2026 CAPEX envelope for a 10,000 m³/day pharma ETP? USD 28–35M total installed, with the MBR + RO package at 45–55% of equipment cost. OPEX lands at USD 0.55–1.20 per m³, and a 60–80% RO permeate reuse case repays the project in 4–6 years.