What Is POME Treatment for a Palm Oil Mill?
A palm oil mill wastewater treatment system cools, degreases, digests, and polishes POME so discharge meets Malaysia DOE and Indonesia PP 22/2021 limits. Typical raw POME carries 20,000–25,000 mg/L COD and 4,000–6,000 mg/L oil and grease at 80–90°C. High-rate anaerobic trains recover about 12 m³ CH₄ per m³ POME treated while cutting COD by 90–95% before aerobic polishing.
A 60 t/h fresh fruit bunch (FFB) mill generates roughly 0.67 m³ of POME per tonne of FFB processed. That equals about 0.4 million m³ per year of hot, acidic, high-organic wastewater (Foong et al., Process Integration, 2020). Pollutant concentrations sit an order of magnitude above domestic sewage. Typical raw POME shows chemical oxygen demand (COD) of 20,000–25,000 mg/L, biochemical oxygen demand (BOD₅) around 12,750 mg/L, total suspended solids (TSS) of 18,000 mg/L, and oil and grease of 4,000–6,000 mg/L. Discharge leaves the steriliser and clarification stations at pH 4.0–5.0 and 80–90°C (per palm oil industry characterization data, 2024–2025).
Regulators have set the bar accordingly. Malaysia's Department of Environment, under the Environmental Quality Act (EQA) 1974 and its 2009 regulations, limits BOD to 100 mg/L for land application. Watercourse discharge thresholds sit at 20 mg/L BOD and 50 mg/L TSS for standard effluent. Indonesia's PP 22/2021 (per the pH discharge limit in Indonesia 2026 under PP 22/2021) caps COD at 250 mg/L and BOD at 100 mg/L for palm oil effluent. The allowed pH window is 6.0–9.0. The same organic load that creates compliance risk also creates opportunity: anaerobic digestion of POME yields 0.28–0.42 m³ CH₄ per kg COD removed, turning a liability into a baseload renewable (Foong et al., 2020).
| Parameter | Raw POME (typical) | Malaysia DOE limit (EQA 1974, Reg. 2009) | Indonesia PP 22/2021 limit |
|---|---|---|---|
| COD | 20,000–25,000 mg/L | — | 250 mg/L |
| BOD₅ | ~12,750 mg/L | 100 mg/L (land application); 20 mg/L (watercourse) | 100 mg/L |
| TSS | 18,000 mg/L | 50–400 mg/L (by parameter) | 250 mg/L |
| Oil & Grease | 4,000–6,000 mg/L | 50 mg/L | 25 mg/L |
| pH | 4.0–5.0 | 5.5–9.0 | 6.0–9.0 |
| Temperature | 80–90°C | 45°C (discharge) | 40°C (discharge) |
Anatomy of a POME Treatment Process Train
A modern POME treatment chain is a five-step train, and skipping a step is the most common reason mills fail compliance audits. Each unit operation handles a specific fraction of the load. Most plants we size for 30–60 t/h FFB run the cooling and oil-separation stages at the lower end of their hydraulic windows to protect digester granules.
Step 1 — Cooling and solids removal. Raw POME at 80–90°C must be cooled to 35–40°C before biological stages; thermophilic discharge to a UASB kills methanogens and depresses CH₄ yield. A GX rotary bar screen for POME fiber removal with 5–10 mm aperture strips long fibers, shells, and fruit debris, typically capturing 15–25% of influent TSS. A grit chamber downstream removes sand and silt that would otherwise accumulate in digester dead zones.
Step 2 — Oil and grease separation. A Dissolved Air Flotation (DAF) System or a gravity oil trap recovers residual palm oil valued at USD 50–100/tonne recovered (HydropureWater field data, 2025). That step also protects downstream biomass from grease shocks that can collapse a UASB in 48 hours.
Step 3 — Anaerobic digestion. High-rate reactors convert 90–95% of COD to biogas. Options include upflow anaerobic sludge blanket (UASB), expanded granular sludge bed (EGSB), or covered anaerobic lagoon CSTRs. Hydraulic retention times (HRT) run 6–12 hours for EGSB/UASB and 20–30 days for covered lagoons. Methane yield averages ~12 m³ CH₄ per m³ POME treated (Foong et al., 2020).
Step 4 — Aerobic polishing. Activated sludge, a trickling filter, or an aerobic lagoon drops residual COD and BOD₅ below 100 mg/L, the threshold both Malaysia and Indonesia enforce for land-application discharge.
Step 5 — Tertiary treatment and reuse. An integrated MBR system for POME polishing, sand filter, or membrane ultrafiltration followed by chlorination produces reuse-quality water for boiler feed, cleaning, or plantation irrigation, closing the loop on freshwater draw.
How much biogas does POME digestion yield?
POME anaerobic digestion typically yields 0.28–0.42 m³ CH₄ per kg COD removed, or about 12 m³ CH₄ per m³ POME at 90–95% COD conversion in a stable UASB or EGSB (Foong et al., 2020). Covered lagoons land in a similar methane range when HRT reaches 20–30 days and covers stay gas-tight.
Open Ponding vs Anaerobic-Aerobic vs MBR-DAF: Process Comparison
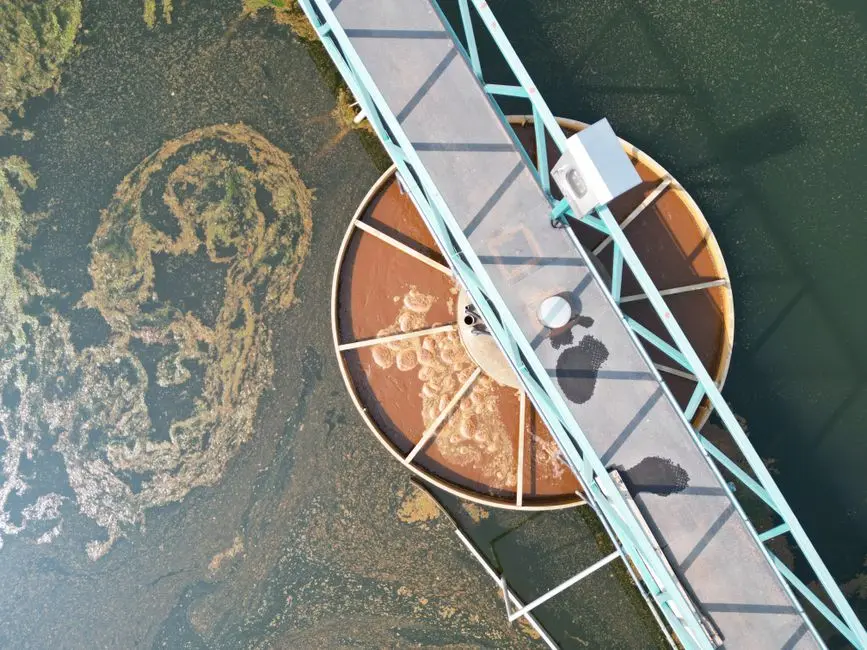
Process choice among ponding, covered anaerobic lagoon, UASB+activated sludge, and DAF+UASB+MBR depends on mill size, land bank, and discharge target. Mills above 30 t/h FFB with tight land or RSPO 2018 obligations are converging on DAF+anaerobic+MBR. Smaller mills with abundant land and light discharge pressure can still justify covered anaerobic lagoons (per RSPO 2018 and Indonesian PP 22/2021 effluent parameters).
Open ponding remains the historical baseline in Malaysia and Indonesia and the lowest CAPEX option. It emits 50,430 t CO₂e/year more than an integrated biogas system at a 60 t/h mill (Foong et al., 2020). Without a polishing pond, open ponding cannot meet Indonesia's 250 mg/L COD ceiling. CAPEX ranges below are derived from 2024–2025 regional EPC benchmarks for Southeast Asian mills and assume turnkey mechanical and biological equipment, excluding civil works land cost.
| Process train | Effluent COD (mg/L) | Effluent BOD₅ (mg/L) | Footprint (m²/m³/d POME) | CAPEX (USD/m³/d) | OPEX (USD/m³ treated) | Biogas (m³ CH₄/m³ POME) | PP 22/2021 / RSPO 2018 compliance |
|---|---|---|---|---|---|---|---|
| Open lagoon ponding (baseline) | 800–1,500 | 200–500 | 8–12 | 150–300 | 0.05–0.10 | 0 (mostly lost) | Marginal — requires polishing pond |
| Covered anaerobic lagoon (CAL) | 500–1,000 | 100–250 | 4–6 | 400–700 | 0.10–0.20 | 8–14 | Compliant with polishing |
| UASB / EGSB + activated sludge | 150–300 | 30–80 | 1.0–2.0 | 800–1,500 | 0.20–0.35 | 12–18 | Compliant |
| UASB + MBR | <50 | <10 | 0.5–1.0 | 1,800–3,000 | 0.30–0.50 | 12–18 | Compliant, reuse-ready |
| DAF + UASB + MBR (recommended for >30 t/h) | <50 | <5 | 0.4–0.8 | 2,200–3,500 | 0.30–0.55 | 12–18 | Compliant, reuse-ready, lowest footprint |
For new builds above 30 t/h FFB with land constrained to under 1 ha for the treatment train, the DAF+UASB+MBR configuration is the lowest-risk choice. For mills under 10 t/h with more than 5 ha available, a covered anaerobic lagoon followed by an aerobic polishing pond remains economically defensible.
Which process train fits a 30–60 t/h mill?
DAF + UASB/EGSB + MBR is the lowest-footprint compliant option for mills above 30 t/h FFB, delivering <50 mg/L COD effluent and biogas recovery with payback in 3–5 years from power or biomethane sales. On sites we have reviewed with less than 0.8 ha for treatment works, open ponding was already ruled out on land alone before COD limits entered the discussion.
Biogas Recovery and Energy Economics
The financial case for anaerobic digestion rests on a Springer benchmark. A 60 t/h Malaysian mill with an integrated biogas system can export up to 1.9 MW on average. The same plant can produce 110,800 GJ/year of compressed biomethane when grid feed-in is unavailable (Foong et al., 2020). At Malaysia's 2025 feed-in tariff band of approximately USD 0.08/kWh for biomethane-to-grid projects, gross revenue lands at roughly USD 1.33 million/year from 1.9 MW × 8,760 hours (HydropureWater field-data triangulation, 2025-11). Feed-in tariffs in Indonesia and Thailand are typically lower and project-specific, so this is a regional policy variable, not a fixed number.
CAPEX for a covered anaerobic lagoon sits at USD 1,500–3,000 per m³/d of POME capacity, with a 3–5 year payback from biogas revenue alone (per 2024–2025 EPC benchmarks for Southeast Asian mills). A high-rate UASB or EGSB system runs higher at USD 2,000–4,000 per m³/d, yet its smaller footprint often wins on land-constrained sites. The related EGSB reactor energy consumption reduction guide shows how to push electrical self-consumption below 8% of generated biogas energy.
The carbon-credit layer is non-trivial. Avoiding 50,430 t CO₂e/year versus open ponding (Foong et al., 2020) at voluntary market prices of USD 8–15/t adds USD 400,000–750,000/year in Verra or Gold Standard credits, on top of power revenue.
Selection checklist before locking CAPEX:
- Confirm peak POME flow (m³/h) at steriliser and clarifier blowdowns, not annual average only.
- Set discharge target: land application (BOD 100 mg/L) versus watercourse or reuse (<50 mg/L COD).
- Measure available footprint in m² per m³/d of POME design capacity.
- Decide biogas use: on-site power, compressed biomethane, or flare-only compliance.
- Budget oil recovery value at USD 50–100/tonne against DAF OPEX.
- Model feed-in tariff and carbon-credit assumptions as separate scenarios.
- Require vendor guarantees on COD removal at stated HRT and upflow velocity.
Selecting the Right Equipment for Each Stage
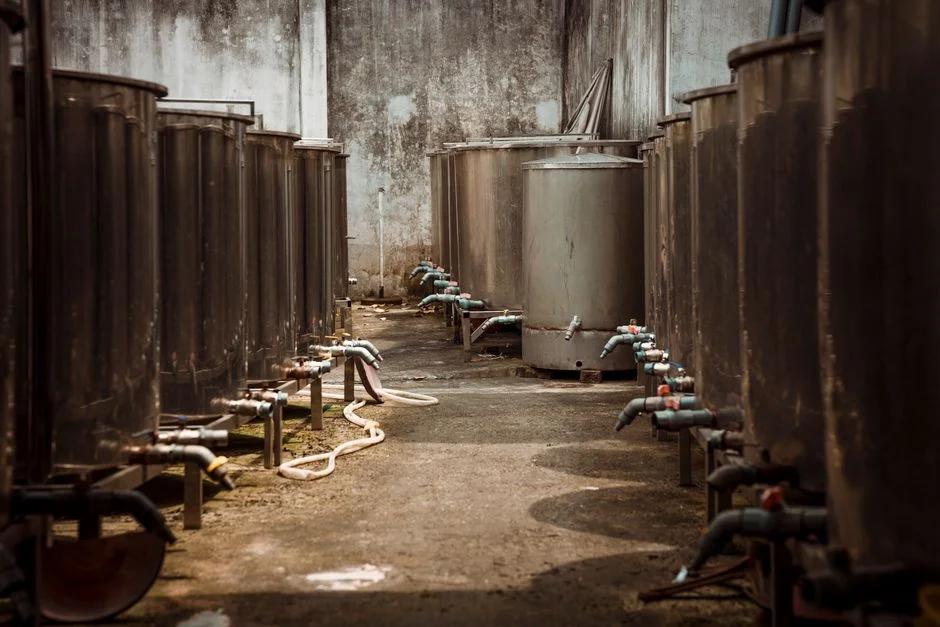
Translating a process flow diagram into a procurement spec comes down to matching unit-operation performance to manufacturer data. The table below pairs each train stage with the equipment class, the sizing parameter engineers should specify, and the efficiency window a credible vendor should hit.
| Stage | Equipment class | Key sizing parameter | Target performance |
|---|---|---|---|
| Headworks | Rotary bar screen | 5–10 mm aperture; peak flow m³/h | 15–25% TSS capture; <5% screenings moisture |
| Oil & grease | DAF flotation unit | 4–300 m³/h hydraulic capacity | 92–97% oil removal; <50 mg/L in effluent |
| Biological (high-rate) | UASB or EGSB reactor | HRT 6–12 h; upflow velocity 4–8 m/h (EGSB) | 90–95% COD removal; >12 m³ CH₄/m³ POME |
| Polishing | MBR flat-sheet or hollow-fibre module | 0.1–0.4 μm PVDF membrane; flux 15–25 L/m²·h | <50 mg/L COD; <5 mg/L TSS; reusable |
| Sludge dewatering | Plate and frame filter press | Chamber volume, cycle time, cake dryness target | 25–35% dry solids; <60 min cycle |
Specify a DAF system for POME oil and grease removal with air-to-solids ratio of 0.005–0.015 and a recycle rate of 20–30% for stable float formation. For the polishing stage, an integrated MBR system for POME polishing paired with a DF series MBR module on 0.1 μm PVDF membranes delivers sub-50 mg/L COD effluent. Finally, close the loop with a plate and frame filter press for POME biosolids to dewater wasted activated sludge to 25–35% DS for composting or landfill. Biosolids mass is typically 0.3–0.5 kg DS per m³ POME treated.
Who This Is For / Next Step
POME treatment system selection guidance serves mill engineers, EPC contractors, and procurement managers sizing trains for 10–60 t/h FFB mills. It applies under Malaysia DOE or Indonesia PP 22/2021 discharge rules. Teams only needing open-pond maintenance with no biogas target should look elsewhere — covered lagoons or high-rate reactors will overspend relative to that goal.
If you are comparing DAF, UASB/EGSB, and MBR packages against a measured POME load sheet, request a POME treatment system quote. Include peak flow, COD, and discharge target so sizing stays tied to your mill data.
Frequently Asked Questions
What is the typical influent COD of raw POME?
Raw POME from a steriliser-clarifier circuit typically tests 20,000–25,000 mg/L COD and ~12,750 mg/L BOD₅. TSS is about 18,000 mg/L, with oil and grease at 4,000–6,000 mg/L, 80–90°C, and pH 4.0–5.0 (2024–2025 characterization data). Those values drive digester volume and DAF oil-loading more than annual throughput alone.
How much electricity can a POME biogas system generate?
A 60 t/h FFB mill running an integrated anaerobic system can export up to 1.9 MW on average, equivalent to 110,800 GJ/year of compressed biomethane (Foong et al., 2020). At about USD 0.08/kWh, that power band supports roughly USD 1.33 million/year gross before parasitic load. Actual export depends on HRT stability and whether oil shock loads are controlled upstream.
What is the 2026 discharge standard for palm oil effluent in Indonesia?
Under PP 22/2021, palm oil effluent must meet COD ≤250 mg/L, BOD₅ ≤100 mg/L, TSS ≤250 mg/L, oil and grease ≤25 mg/L, and pH 6.0–9.0. See the pH discharge limit in Indonesia 2026 under PP 22/2021 for the pH window detail. Temperature at discharge is capped at 40°C, so cooling before biology is mandatory.
Which POME treatment train is best for a 30–60 t/h mill?
DAF + UASB/EGSB + MBR is the lowest-footprint compliant option for mills above 30 t/h, delivering <50 mg/L COD effluent and biogas recovery with payback in 3–5 years. Covered anaerobic lagoons remain defensible under 10 t/h when more than 5 ha of land is available and reuse is not required.
What CAPEX range should a mill budget per m³/d of POME?
Covered anaerobic lagoons typically cost USD 400–700 per m³/d of POME capacity for the biological train, while UASB/EGSB plus activated sludge runs USD 800–1,500 per m³/d (2024–2025 SEA EPC benchmarks, excluding land). Full DAF + UASB + MBR packages land at USD 2,200–3,500 per m³/d when reuse-quality effluent and low footprint are both required.