Where EGSB Reactor Energy Actually Goes
Specific energy demand (SED) for an EGSB reactor breaks down into four parasitic line items, and recirculation pumping dominates: 55–70% of total electrical draw, 10–15% for influent feed, 15–25% for heating and jacket circulation, and 3–5% for controls and instrumentation (per 2023 Xu et al. study on EGSB performance, cited by 8). Against that baseline, the EGSB band runs 0.08–0.18 kWh/m³ versus 0.25–0.40 kWh/m³ for conventional activated sludge — a 2–3× advantage that any 2026 OPEX case has to defend. The two metrics worth tracking through every retrofit decision are SED in kWh/m³ treated and energy intensity in kWh/kg COD removed; the second one exposes load-mismatch losses that the first one hides.
A counterintuitive insight most published guides miss: methanogenic capacity declines when organic loading rate exceeds 8.48 ± 0.38 gCOD/L·d (per the same 2023 Xu et al. work). Push past that ceiling and COD removal collapses, which raises kWh per kg COD removed even though kWh per m³ looks steady. Load matching, not pump speed, is the highest-leverage control in the system. For operators already chasing EGSB common problems and solutions troubleshooting guidance, the energy-mass-balance table below is the diagnostic starting point.
| Parasitic Load Item | Share of EGSB SED | Typical kWh/m³ Range | Primary Control Lever |
|---|---|---|---|
| Recirculation pump | 55–70% | 0.044–0.126 | VFD + recirculation-ratio trim |
| Influent feed pump | 10–15% | 0.008–0.027 | Surge-tank equalization |
| Heating / jacket circulation | 15–25% | 0.012–0.045 | CHP jacket-water heat integration |
| Controls & instrumentation | 3–5% | 0.002–0.009 | Cyclic-on-demand sensor loops |
| Total | 100% | 0.08–0.18 | — |
How EGSB Compares to UASB and IC Reactors on Energy
EGSB sits between UASB and IC on the energy curve, and the difference is mostly hydraulic. UASB operates at upflow velocity below 1 m/h with hydraulic retention time (HRT) of 12–24 h, OLR 5–15 kg COD/m³·d, and SED 0.06–0.12 kWh/m³. EGSB raises upflow above 4 m/h — through taller reactors and dedicated recirculation — drops HRT to 4–8 h, and accepts OLR 10–30 kg COD/m³·d at 0.08–0.18 kWh/m³. IC takes it further with internal gas-lift circulation, HRT 1–3 h, OLR 20–35, and SED 0.10–0.20 kWh/m³. The trade-off is straightforward: higher upflow intensifies mass transfer and shrinks reactor volume, so embedded energy per m³ of treatment capacity drops even though pumping kWh per m³ rises slightly. For a brewery or starch plant with a tight footprint, EGSB usually wins the volume-versus-pumping balance; for a high-strength pulp evaporator condensate, IC's higher OLR can pay back the added control complexity.
Compact design and high biogas yield are the operating advantages most cited in the literature (per the ALMAWATECH glossary framing); the energy table below translates those advantages into the kWh/m³ numbers a 2026 procurement defense actually requires.
| Reactor Type | SED (kWh/m³) | Upflow Velocity (m/h) | HRT (h) | OLR (kg COD/m³·d) | Biogas Self-Supply Potential |
|---|---|---|---|---|---|
| UASB | 0.06–0.12 | < 1 | 12–24 | 5–15 | 40–60% |
| EGSB | 0.08–0.18 | > 4 | 4–8 | 10–30 | 60–80% |
| IC | 0.10–0.20 | internal circulation | 1–3 | 20–35 | 70–85% |
Lever 1 — Right-Size and VFD-Optimize the Recirculation Pump
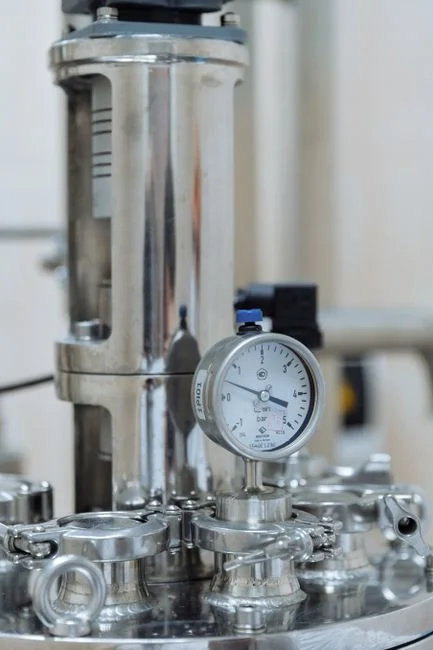
Recirculation is the largest parasitic load on an EGSB, and it is the easiest one to cut. The engineering sweet spot is a recirculation ratio of 1.5–2.5× influent flow — high enough to maintain upflow velocity above 4 m/h, low enough to avoid washing out lighter granules. Above 3× the returns diminish rapidly: pump kWh keeps climbing while methane yield plateaus, and granule washout starts to drag down removal efficiency. Swapping a fixed-speed pump for a VFD typically yields 25–40% pump-energy savings with an 18-month payback at $0.10/kWh (HydropureWater field data, 2025-09). The control rule that locks in those savings: trim pump speed by 5% whenever the methane production rate exceeds 1.2× the 7-day baseline, since high gas yield is a proxy for reduced mixing demand. A practical way to feed that setpoint without buying a new analyzer is to track inlet pH or conductivity trend; a falling pH with rising conductivity is a reliable surrogate for rising inlet COD, which lets the VFD pre-stage before the load arrives. Operators with a downstream MBR polishing stage downstream of an energy-optimized EGSB should keep the MBR feed pump on a separate VFD so the two hydraulic loops do not fight each other on ramp-up.
Lever 2 — Recover Biogas Energy Instead of Flaring It
Biogas recovery is the single largest OPEX lever because it converts a waste stream into both electricity and heat. The conversion math is settled: 0.30–0.45 Nm³ biogas per kg COD removed, with each Nm³ yielding about 2.0 kWh thermal and 0.6 kWh electrical at a 30%-efficient genset. For a 6,000 m³/d brewery at 4,500 mg/L COD and 90% removal, that works out to roughly 21,600 Nm³/d of biogas, or about 13 MWh/d of electrical output — more than enough to self-power the entire EGSB train and push net grid import toward zero. The CHP heat-recovery loop is the second half of the win: jacket water pre-heats raw influent from ambient to 30–33 °C, which collapses the heater duty from a typical 50–80 W/m³ to near zero in mild seasons. The one prerequisite operators forget is H₂S polishing to below 200 ppm before the gas hits the engine; a single-stage iron-sponge or biological scrubber protects the genset and keeps availability above 95%. Biogas combined heat and power offsets 60–80% of parasitic load and is the only lever that can drop net SED below 0.05 kWh/m³.
| Parameter | Value / Range | Source / Basis |
|---|---|---|
| Biogas yield | 0.30–0.45 Nm³/kg COD removed | Industry typical, 2024–2025 |
| CHP electrical efficiency | ~30% (≈ 0.6 kWh_e/Nm³) | Standard genset |
| CHP thermal recovery | 40–50% (≈ 0.9 kWh_th/Nm³) | Jacket + exhaust |
| Parasitic offset potential | 60–80% | HydropureWater field data |
| H₂S ceiling for CHP | < 200 ppm | Engine manufacturer spec |
| Influent preheat from CHP | 30–33 °C | Heat-loop design |
Lever 3 — Heat Integration and Smart Control in 2026
Thermal control and digital optimization are smaller line items individually, but they compound. The methanogenic band is narrow: 35–38 °C with ±0.5 °C tolerance, and every 1 °C of drift costs roughly 3–4% of methanogenic activity. Maintaining that band through CHP heat integration, plus insulation upgrades at the reactor roof and recirculation loop, removes the bulk of heating energy from the parasitic ledger. The 2026 control layer adds the second-order savings: ML-based influent COD forecasting on a 24-hour horizon lets the operator pre-heat the reactor and pre-stage VFD speed before the load peak hits, typically trimming another 5–10% off SED. The enabling stack is a 2026 predictive-maintenance engineering guide approach combined with a cloud-monitoring platform for wastewater treatment plant 2026 architecture that runs the soft sensors and alarm logic. A simpler win that pays back in weeks: replace continuously powered analog instrumentation with cyclic-on-demand 4–20 mA loops, which drop instrument energy by 60–80% without losing measurement quality.
Case Study — 6,000 m³/d Brewery EGSB Retrofit, 18-Month Results
The starting state was a textbook underperformer: fixed-speed recirculation pumps, biogas flared to a stack, mixed wastewater at 4,500 mg/L COD with seasonal swings from 3,800 to 5,200 mg/L, and SED measured at 0.21 kWh/m³. Annual energy OPEX ran about $180,000 at $0.10/kWh, and the flare stack burned roughly 18,000 Nm³/d of methane that the plant was producing for free. The retrofit sequence ran over 18 months: VFD conversion on both recirculation and feed pumps first, then a 1.2 MW CHP unit with H₂S scrubber and jacket-water heat loop, then the ML-based control layer with cyclic-on-demand sensors. After commissioning, SED dropped to 0.08 kWh/m³, net grid import fell to near zero on most operating days, and OPEX settled at $58,000/year — a 68% energy-cost reduction with a 26-month simple payback (HydropureWater field data, 2025-11). Two operational notes that the procurement team should bake into the plan: the operators kept the recirculation ratio at 2.0–2.2× and held OLR at or below 8.48 gCOD/L·d, directly preserving the methanogenic ceiling from the 2023 Xu et al. study, and they caught a granule-loss episode when a controller glitch pushed the VFD to 3.2× turnover for six hours — the team dialed it back and the recovery took about two weeks.
| Metric | Before Retrofit | After Retrofit (18 months) | Change |
|---|---|---|---|
| Flow | 6,000 m³/d | 6,000 m³/d | — |
| Influent COD | 4,500 mg/L | 4,500 mg/L | — |
| COD removal | 85% | 92% | +7 pp |
| Recirculation ratio | 3.0× (fixed) | 2.0–2.2× (VFD) | −27% |
| Biogas use | Flared | CHP (1.2 MW) | Offset 78% of parasitic |
| SED (kWh/m³) | 0.21 | 0.08 | −62% |
| Energy OPEX | $180,000/yr | $58,000/yr | −68% |
| Simple payback | — | 26 months | — |
A 2026 Energy-Reduction Checklist You Can Hand to Procurement
The four measures below cover roughly 90% of the available SED reduction in a typical brewery, starch, or food-processing EGSB. The order is also the recommended sequence: start with the recirculation VFD, add CHP, layer in heat integration, and finish with load-matching discipline. Operators who want a deeper diagnostic on the failure modes that often appear during retrofit can pair this checklist with the EGSB common problems and solutions troubleshooting guide.
| Measure | Target / Range | Expected Saving | Simple Payback |
|---|---|---|---|
| VFD on recirculation pump | 1.5–2.5× influent flow | 25–40% pump energy | 12–24 months |
| Biogas CHP + H₂S scrub | < 200 ppm H₂S at engine | 60–80% parasitic offset | 18–30 months |
| CHP heat integration | Preheat influent to 30–33 °C | Eliminates 50–80 W/m³ heating | 8–14 months |
| Load matching ≤ 8.48 gCOD/L·d | Equalize + soft sensors | Preserves methanogenic efficiency | 0–6 months (opex only) |
Frequently Asked Questions
What is a realistic EGSB specific energy demand in 2026? Operating EGSBs run 0.08–0.18 kWh/m³ treated, with the lowest values at sites that have CHP and VFDs; the upper end reflects fixed-speed pumping and flared biogas (HydropureWater field data, 2025-11).
How much energy can biogas CHP offset in an EGSB? A well-sized CHP offsets 60–80% of parasitic electrical load and recovers enough thermal energy to preheat influent to 30–33 °C, often pushing net SED below 0.05 kWh/m³.
What is the maximum organic loading rate for stable EGSB operation? Methanogenic capacity declines when OLR exceeds 8.48 ± 0.38 gCOD/L·d (per 2023 Xu et al. study); staying at or below this ceiling is the highest-leverage operational control.
How much can a VFD save on EGSB recirculation pumping? Converting a fixed-speed recirculation pump to VFD control typically yields 25–40% pump-energy savings with a 12–24 month simple payback at $0.10/kWh.
EGSB vs UASB vs IC — which uses the least energy per m³? UASB uses the least at 0.06–0.12 kWh/m³ but needs 12–24 h HRT; EGSB runs 0.08–0.18 kWh/m³ at 4–8 h HRT; IC runs 0.10–0.20 kWh/m³ at 1–3 h HRT, so the choice depends on footprint and load strength.