Why Predictive Maintenance Matters for Wastewater Treatment Plants in 2026
A predictive maintenance system for a wastewater treatment plant combines vibration and motor-current sensors on rotating equipment, dissolved-oxygen and MLSS probes in biological reactors, and transmembrane-pressure transmitters on membrane modules, streaming data to an edge gateway and ML model that forecasts failure 7–30 days in advance. In 2026 deployments, plants report 30–50% reductions in unplanned downtime and 15–25% lower energy use on aeration blowers, typically paying back the system in 12–24 months.
Aeration blowers alone draw 50–60% of a typical municipal WWTP's total electricity, and the Springer LCA study of municipal plants confirms energy and chemical inputs as the dominant environmental and economic hotspots (CML 2002 methodology, empirical data 2000–2001). When a blower or feed pump fails without warning, the plant loses biological treatment capacity, risks a discharge consent violation, and pays emergency-rental rates that dwarf preventive-maintenance labor costs. A concrete example: a single 75 kW aeration blower failure in a 10,000 m³/day plant costs roughly $4,800/day in emergency rental plus lost treatment capacity — and that figure excludes any regulatory fine.
Yokogawa's published PdM touchpoint map for the water sector scopes the asset coverage to four classes: influent wastewater pumps, aeration tank blowers and pumps, sludge feed and removal equipment, and dewatering equipment. This article uses that scope as the engineering frame. In 2026, stricter discharge consents, electricity tariffs that have risen 20–35% since 2022 in most U.S. and EU markets, and a measurable labor shortage in skilled maintenance trades have pushed condition-based maintenance from a "nice to have" into a regulatory and economic necessity.
The Four Asset Classes a WWTP PdM System Must Cover
A defensible PdM architecture begins by mapping the four asset classes that account for the majority of unplanned downtime events: centrifugal pumps, aeration blowers, membrane modules, and bar screens/sludge dewatering. Each class has a distinct failure signature, a distinct sensor stack, and a different prediction horizon — and the model architecture is shaped by those differences.
Class 1 — Centrifugal pumps (influent, return-activated sludge, transfer): dominant failure modes are impeller cavitation and mechanical-seal wear, which accelerate under off-design flow. The condition-monitoring sensor stack is a triaxial accelerometer on the bearing housing (sampling at ≥10 kHz to capture bearing-race frequencies) plus a motor current signature analysis (MCSA) clamp on the motor feed, which detects rotor-bar defects and air-gap eccentricity. Typical prediction horizon: 14–30 days, matching the gradual progression of seal wear and cavitation erosion. This aligns with Yokogawa's influent-pump PdM touchpoint.
Class 2 — Aeration blowers (positive-displacement lobe and turbo): dominant failure modes are rotor fouling from oil aerosol, inlet-filter clogging, and bearing wear. Predict with inlet-air pressure differential, motor kW trending, and bearing vibration; the dissolved-oxygen probe in the aeration tank is the process-level leading indicator because fouling reduces oxygen-transfer efficiency before the bearing fails, per the Springer neural-network MPC framework for DO control. Prediction horizon: 7–21 days.
Class 3 — Membrane modules (MBR/UF): dominant failure mode is fouling, with breakage as a secondary risk during transients. Predict with transmembrane pressure (TMP) trend and permeability decline, typically expressed as flux per unit TMP. Prediction horizon: 5–14 days — shorter than rotating equipment because fouling kinetics are faster. Operating data from DF series PVDF flat sheet membrane modules with integrated aeration scouring shows that TMP-driven cleaning triggers cut chemical CIP frequency 20–40% versus calendar-based cleaning.
Class 4 — Bar screens and sludge dewatering: dominant failure modes are rake overload and hydraulic-pressure creep on filter presses. Predict with motor torque, hydraulic pressure transmitter on the press cylinder, and rake-cycle-time anomaly detection. Operating principles of GX series rotary mechanical bar screens and HydropureWater plate and frame filter presses define the baseline cycle times and pressures against which anomalies are flagged. Prediction horizon: 7–21 days.
| Asset Class | Dominant Failure Modes | Primary Sensors | Process Leading Indicator | Prediction Horizon |
|---|---|---|---|---|
| Centrifugal pumps | Impeller cavitation, seal wear | Triaxial accelerometer, MCSA clamp | Suction-side pressure | 14–30 days |
| Aeration blowers | Rotor fouling, filter clog, bearing wear | Bearing vibration, motor kW, inlet ΔP | Dissolved oxygen | 7–21 days |
| Membrane modules (MBR/UF) | Fouling, breakage | TMP transmitter, flow, temperature | Permeability (flux/TMP) | 5–14 days |
| Bar screens / dewatering | Rake overload, hydraulic creep | Motor torque, hydraulic pressure, cycle timer | Upstream head differential | 7–21 days |
Sensor Stack and Data Architecture: From Field to Forecast
The data architecture is best described in four layers, and a plant that already runs SCADA/PLC will recognize that two of these layers are already partially in place. The PdM retrofit adds the condition-monitoring sensors and the ML inference layer on top of the existing process-control stack.
Layer 1 — Process sensors (already installed on most WWTPs): dissolved oxygen (DO), pH, temperature, MLSS, flow, level, and pressure. These are the process-context inputs that contextualize rotating-equipment health — for example, a vibration spike on a blower is only meaningful if correlated with the simultaneous DO reading and ambient air temperature.
Layer 2 — Condition-monitoring sensors (to be added): triaxial accelerometers on pump and blower bearings sampling at ≥10 kHz, MCSA clamps on motor feeders, TMP transmitters on membrane trains, and inlet/dead-end pressure differential transmitters on blowers. Selection criteria for chemical-plant service, including material compatibility and hazardous-area ratings, are covered in detail in the engineering guide on IoT sensor selection for chemical wastewater plants.
Layer 3 — Edge gateway: an industrial PC or PLC with an OPC-UA server, buffering data locally and publishing to the historian (OSIsoft PI, Ignition, or AVEVA) at 1-second to 1-minute cadence. The Springer 2021 ML paper on health-indicator construction establishes the precedent for handling high-dimensional unlabeled industrial data at this layer using unsupervised feature extraction before cloud upload.
Layer 4 — Cloud or on-prem ML: anomaly detection (Isolation Forest, autoencoder) for unsupervised learning on unlabeled historical data, then supervised remaining-useful-life models once failure labels accumulate. The Springer health-indicator framework adapted to WWTP assets works as follows: build a one-class model on healthy-state data, flag deviations as health-index scores between 0 and 1, then regress that score against run-hours-to-failure once the first confirmed failures are labeled through the CMMS feedback loop.
| Layer | Function | Typical Components | Cadence | Already in Place? |
|---|---|---|---|---|
| 1 — Process sensors | Process context | DO, pH, MLSS, flow, level, pressure | 1–10 s | Usually yes |
| 2 — Condition sensors | Equipment health | Accelerometer, MCSA, TMP, ΔP | 1 s to 10 kHz | No — to be added |
| 3 — Edge gateway | Buffering, OPC-UA publish | Industrial PC/PLC, OPC-UA server | 1 s to 1 min | Partial — historian exists |
| 4 — ML inference | Anomaly detection, RUL | Isolation Forest, autoencoder, regressor | 1 min to 1 h | No — to be added |
Building the 2026 ROI Model: Downtime Math and Payback Periods
The defensibility of a PdM capex request rests on three quantifiable buckets: avoided downtime, energy savings, and membrane/chemical savings. Each is calculable from existing plant data with conservative assumptions.
Downtime cost. Lost treatment capacity × consent-violation risk + emergency rental + overtime labor. For a 10,000 m³/day plant, one blower down for 48 hours typically carries $8K–$15K direct cost (emergency rental at $1,500–$3,000/day plus 2× overtime labor) plus regulatory exposure that can run an order of magnitude higher in a chronic-violation scenario. Avoiding two such events per year justifies the bulk of the PdM capex on its own.
Energy savings. Condition-based aeration control — modulating blower output against real-time DO rather than running at constant output — typically cuts blower energy 15–25%. On a 200 kW blower fleet at $0.10/kWh running 8,000 hours/year, that is $26K–$44K/year at the 2026 tariff baseline. The Yokogawa aeration-tank monitoring touchpoint identifies this as the highest-leverage PdM application in the wastewater sector.
Membrane and chemical savings. TMP-driven cleaning triggers (versus calendar-based CIP) reduce chemical clean-in-place frequency 20–40% per DF series operating data, saving $15K–$40K/year in chemicals and lost flux on a 5,000 m² membrane installation. Sludge-handling savings stack on top of this, and the methodology for sizing them is laid out in the 2026 sludge disposal cost benchmarks.
Capex benchmarks. A 5,000–20,000 m³/day retrofit PdM system including sensors, edge gateway, and ML software runs $80K–$350K installed in 2026, depending on the number of instrumented assets and whether the ML layer is licensed or built in-house. Payback of 12–24 months is typical under current energy and labor cost conditions.
| Savings Bucket | Calculation Basis | Annual Range (2026) | Data Confidence |
|---|---|---|---|
| Avoided downtime | 2 avoided 48-h events/yr × $8K–$15K | $16K–$30K + avoided fines | High (asset-specific) |
| Aeration energy | 200 kW × 8,000 h × 15–25% × $0.10/kWh | $26K–$44K | High (Yokogawa + Springer) |
| Membrane CIP chemicals | 5,000 m² × 20–40% CIP reduction | $15K–$40K | Medium (DF-series field data) |
| Total annual savings | Sum (conservative) | $57K–$114K | — |
| PdM capex (retrofit) | 5K–20K m³/day plant | $80K–$350K | Vendor-quoted range |
| Payback period | Capex ÷ annual savings | 12–24 months | — |
90/180/365-Day Deployment Roadmap for Existing SCADA-Equipped Plants
Most WWTP PdM retrofits do not require a greenfield OT network. The roadmap below assumes an existing SCADA/PLC infrastructure with a working historian and targets pilot-to-scale rollout without process interruption.
Days 0–90 — Instrumentation and gateway commissioning. Audit existing instruments against the four asset classes. Install vibration and TMP sensors on the highest-criticality assets (typically the largest blower and one membrane train). Commission the edge gateway on the existing SCADA network via OPC-UA; confirm that historians accept the new tag streams at the planned cadence. Keep the existing controls untouched during this phase.
Days 90–180 — Baseline and model training. Collect 60–90 days of baseline data from the pilot assets. Train unsupervised anomaly-detection models (Isolation Forest or autoencoder) and validate against the historical failure log. Avoid the common mistake of trying to model all assets at once — pilot on one class first and confirm that the alerts align with known failure precursors before expanding scope. The O&M KPIs framework for data-driven O&M provider reporting is a useful template for the alert-to-action workflow during this phase.
Days 180–365 — Scale-out and CMMS integration. Roll out to the remaining pump and blower fleets in priority order. Integrate ML alerts into the CMMS (SAP PM, IBM Maximo) so that work orders are generated automatically. Close the feedback loop by tagging confirmed failures in the CMMS back into the training set, so the model learns from labeled events and the remaining-useful-life predictions improve over time. Contract structures for this phase, including outcome-based SLAs, are detailed in the guide to outsourcing contract O&M for wastewater treatment.
Frequently Asked Questions
How much does a predictive maintenance system for a wastewater treatment plant cost in 2026? A 5,000–20,000 m³/day retrofit including sensors, edge gateway, and ML software runs $80K–$350K installed, with 12–24 month payback at current energy and labor cost conditions.
Which sensors are mandatory for a WWTP PdM pilot? Triaxial accelerometers on pump and blower bearings, motor current signature analysis clamps on motor feeders, and a transmembrane pressure transmitter on at least one membrane train — these three cover the highest-cost failure modes.
What ML approach works with limited WWTP failure data? Start with unsupervised anomaly detection (Isolation Forest or autoencoder) on unlabeled historical data, then move to supervised remaining-useful-life models once 6–12 months of CMMS-labeled failures accumulate.
Can PdM be retrofitted onto an existing SCADA-equipped plant without shutdown? Yes. Vibration and TMP sensors install on de-energized equipment during scheduled maintenance windows, and the OPC-UA edge gateway publishes to the existing historian without changes to PLC control logic.
What does MBR-specific predictive maintenance look like? The leading indicator is transmembrane pressure trend; a TMP rise above the clean-water baseline by 20–30 kPa typically triggers a chemical CIP, and an exponential rather than linear TMP rise indicates fouling that needs investigation before recovery cleaning is attempted. Operating data from HydropureWater MBR membrane bioreactor systems confirms this pattern across municipal installations.
Related Equipment
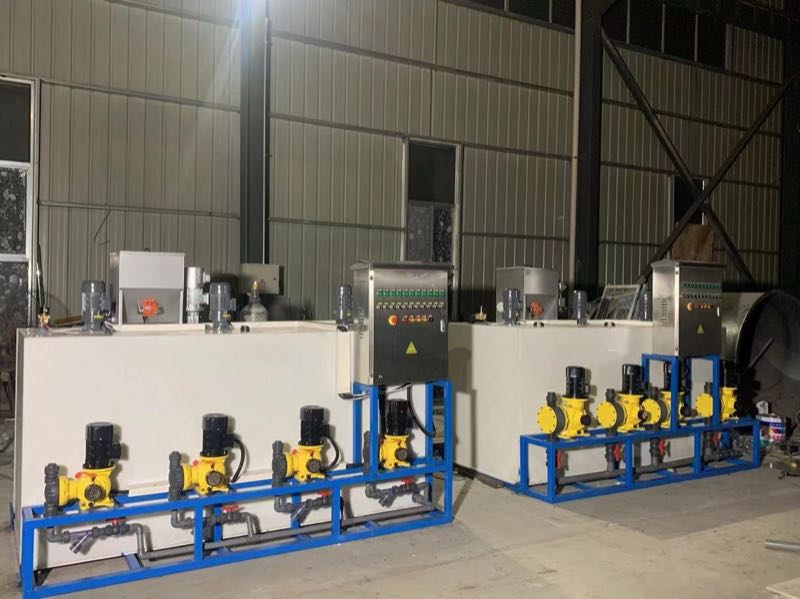
- automatic chemical dosing systems — specifications, capacity range, and technical data