Beyond Trust: Measuring What Matters in Contract O&M
Hiring a third-party operations and maintenance (O&M) provider for your wastewater treatment plant is a significant decision that involves substantial annual expenditure and considerable operational risk. Yet many facility owners evaluate their O&M contractors based on little more than gut feeling, occasional site visits, and whether or not they received a permit violation notice.
This approach is inadequate. In an era where every other business function is measured, benchmarked, and optimized using data, wastewater treatment operations should be no different. The best contract O&M relationships are built on clearly defined key performance indicators (KPIs), structured reporting, transparent data, and a shared commitment to continuous improvement.
This article provides a comprehensive framework for measuring and managing third-party O&M performance — whether you are a facility owner drafting a new contract, an existing client looking to improve accountability, or an O&M provider wanting to differentiate through transparency.
The Four Pillars of O&M Performance Measurement
Effective performance measurement covers four domains. Focusing exclusively on any one area creates blind spots that can lead to costly surprises.
1. Compliance Performance
This is the non-negotiable baseline. If the plant is not meeting its discharge permit, nothing else matters. But compliance measurement should go beyond simple pass/fail to provide early warning of deteriorating performance.
2. Operational Efficiency
How effectively is the contractor using energy, chemicals, and labor to achieve treatment objectives? Efficient operations reduce your costs and demonstrate technical competence.
3. Asset Management
Is the contractor maintaining your equipment properly and extending asset life, or are they deferring maintenance to pad short-term margins at the expense of long-term asset value?
4. Management and Communication
Does the contractor provide timely, accurate, and useful information? Are they proactive about identifying issues and recommending improvements?
Essential KPIs for Wastewater O&M Contracts
The following KPIs provide comprehensive coverage of contractor performance. Not every facility needs every KPI — select the ones most relevant to your treatment process, permit requirements, and management priorities.
Compliance KPIs
| KPI | Definition | Target | Reporting Frequency |
|---|---|---|---|
| Permit Compliance Rate | Percentage of monitored parameters meeting permit limits | 100% | Monthly |
| Compliance Margin | Average effluent value as % of permit limit (e.g., BOD at 60% of limit) | <70% of limit | Monthly |
| Exceedance Frequency | Number of individual parameter exceedances per quarter | 0 | Quarterly |
| Trend Compliance | 3-month rolling average direction (improving/stable/declining) | Stable or improving | Monthly |
The most important of these is Compliance Margin. A plant that consistently operates at 90% of its BOD permit limit is one bad day away from a violation, while a plant at 50% of its limit has substantial buffer. Tracking compliance margin over time reveals whether performance is drifting toward or away from limits — long before an actual exceedance occurs.
Operational Efficiency KPIs
| KPI | Definition | Benchmark | Reporting Frequency |
|---|---|---|---|
| Energy Intensity | kWh per cubic meter of wastewater treated | 0.3-0.8 (secondary treatment) | Monthly |
| Chemical Cost per Volume | $ per cubic meter treated | Facility-specific baseline | Monthly |
| Sludge Production Rate | kg dry solids per kg BOD removed | 0.4-0.8 (activated sludge) | Monthly |
| Specific Energy for Aeration | kWh per kg O2 delivered | 0.5-1.0 (fine bubble) | Quarterly |
| Chemical Dosing Efficiency | Actual dose vs. jar test optimal dose | Within 15% | Monthly |
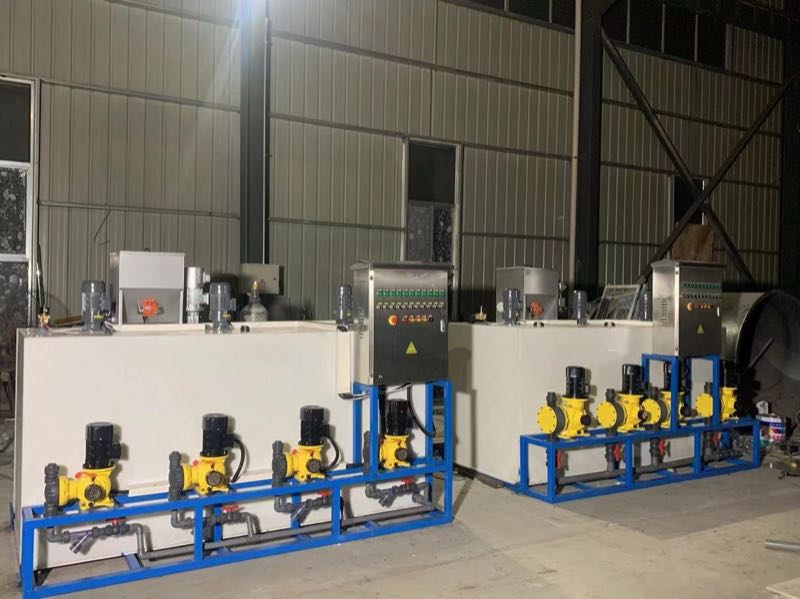
These KPIs should be baselined during the first 3-6 months of the contract and then trended over time. A competent contractor should demonstrate measurable efficiency improvements within the first 12-18 months as they optimize the process. Using properly calibrated automated chemical dosing systems is a key enabler for achieving and maintaining optimal chemical efficiency.
Asset Management KPIs
| KPI | Definition | Target | Reporting Frequency |
|---|---|---|---|
| PM Completion Rate | % of scheduled preventive maintenance tasks completed on time | >90% | Monthly |
| Reactive/Planned Ratio | Ratio of unplanned to planned maintenance work orders | <20% reactive | Monthly |
| Equipment Availability | % of time critical equipment is operational | >95% | Monthly |
| Mean Time Between Failures | Average operating hours between equipment failures | Increasing trend | Quarterly |
| Maintenance Backlog | Total hours of outstanding maintenance work | 2-4 weeks of capacity | Monthly |
Asset management KPIs are the best leading indicators of long-term plant health. A contractor who achieves great compliance results by deferring maintenance is borrowing against the future — and the bill will come due in the form of equipment failures, emergency repairs, and shortened asset life.
Management and Communication KPIs
| KPI | Definition | Target | Reporting Frequency |
|---|---|---|---|
| Report Timeliness | Monthly report delivered within X days of month end | Within 10 business days | Monthly |
| Incident Response Time | Time from alarm/incident to on-site response | <2 hours (critical), <24 hours (routine) | As needed |
| Safety Incident Rate | Recordable incidents per 200,000 hours worked | 0 | Quarterly |
| Regulatory Submission Timeliness | DMRs and reports submitted before deadline | 100% | Monthly |
| Improvement Recommendations | Number of actionable improvement recommendations per quarter | >2 | Quarterly |
Structuring the Reporting Framework
KPIs are only valuable if they are communicated effectively. The reporting framework should include multiple levels of detail for different audiences.
Daily Operations Log
A brief daily summary (1-2 pages or dashboard) covering: flows treated, key effluent parameters, equipment status, chemical usage, any abnormal conditions or incidents, and corrective actions taken. This log should be accessible to the facility owner via a shared SCADA dashboard or cloud-based reporting platform.
Monthly Performance Report
The cornerstone of O&M reporting. A well-structured monthly report should include:
- Executive summary: 1-page overview of compliance status, key operational metrics, significant events, and action items
- Compliance dashboard: All monitored parameters vs. permit limits with trend graphs
- Operational data: Flow, loadings, MLSS, SRT, DO, SVI, chemical consumption, energy consumption
- Maintenance summary: PM completion, work orders completed, equipment issues, upcoming maintenance needs
- Cost summary: Chemical costs, energy costs, sludge disposal costs, and parts costs vs. budget
- Safety report: Incidents, near-misses, training completed
- Upcoming items: Planned maintenance, regulatory submittals, capital recommendations
Quarterly Strategic Review
A face-to-face meeting (or detailed written report) that covers:
- Performance trends and year-over-year comparisons
- Cost analysis and budget variance
- Asset condition assessment and capital planning updates
- Process improvement recommendations with cost-benefit analysis
- Staffing updates — training completed, certifications obtained, turnover
- Regulatory updates — upcoming permit changes, new requirements
Annual Performance Summary
A comprehensive year-end report documenting full-year performance against all contract KPIs, total costs vs. budget, capital expenditure recommendations for the coming year, and a 3-5 year strategic outlook. This report is the primary tool for contract renewal negotiations and long-term planning.
Building an Effective O&M Dashboard
The shift from paper reports to digital dashboards is transforming O&M management. A well-designed dashboard provides real-time visibility into plant performance without requiring anyone to wait for monthly reports.
Essential Dashboard Elements
- Real-time compliance gauges: Current effluent parameters displayed as percentage of permit limit with color-coded status (green/yellow/red)
- Flow and loading trends: 24-hour, 7-day, and 30-day trends for influent flow and key loading parameters
- Energy consumption: Daily and monthly kWh with cost, trended against the same period last year
- Chemical inventory: Current tank levels and projected days of supply for all treatment chemicals
- Equipment status: Run/stop/fault status of all critical equipment with operating hours
- Alarm log: Active and recent alarms with response status
- Maintenance calendar: Upcoming PM tasks and overdue items
Modern SCADA platforms and cloud-based monitoring tools make it practical to build these dashboards for facilities of any size. The technology investment is modest ($10,000-$50,000) compared to the value of real-time operational visibility.
Using Data to Drive Continuous Improvement
The purpose of KPIs and reporting is not just accountability — it is continuous improvement. Data-driven O&M management follows a systematic cycle.
Measure and Baseline
Establish baseline performance during the first 3-6 months of a new contract. This baseline represents the starting point against which all future improvements are measured.
Analyze and Identify Opportunities
Use the data to identify the largest cost drivers and the biggest gaps between current and optimal performance. For example, if energy intensity is 0.7 kWh/m³ and the benchmark for your treatment process is 0.4-0.5 kWh/m³, there is a clear optimization opportunity.
Implement and Monitor
Make changes — process adjustments, equipment upgrades, operational procedure changes — and monitor the impact. A good O&M contractor will present improvement initiatives with projected benefits, implement them, and then report actual results vs. projections.
Benchmark and Compare
Large O&M firms can benchmark your facility against their entire portfolio of similar plants. This cross-facility benchmarking identifies practices and technologies that work at other sites and could benefit yours. For example, one client facility might achieve exceptional chemical efficiency using a specific MBR system configuration that could be replicated at similar facilities.
Performance-Based Contract Structures
The most effective O&M contracts tie a portion of the contractor's compensation to KPI performance. Common structures include:
Fixed Fee Plus Performance Bonus
The contractor receives a fixed base fee covering all routine O&M costs, plus a performance bonus (typically 5-15% of the base fee) for meeting or exceeding defined KPI targets. This structure provides a stable revenue base for the contractor while incentivizing superior performance.
Gainsharing
Cost savings (energy, chemicals, sludge disposal) below the baseline are split between the owner and contractor, typically 50/50 or 60/40. This powerfully aligns the contractor's financial interest with the owner's cost reduction objectives. A contractor who reduces annual chemical costs by $50,000 through optimized dosing receives $25,000 of the savings — a direct incentive for continuous improvement.
Penalty/Bonus for Compliance
Financial penalties for permit violations (beyond regulatory fines, which the owner bears) and bonuses for maintaining compliance margin below defined thresholds. For example, a $5,000 monthly bonus for maintaining all parameters below 70% of permit limits, and a $10,000 penalty per exceedance event.
Common Pitfalls in O&M Performance Management
Even well-intentioned performance management programs can fail if they fall into these traps:
- Too many KPIs: Tracking 50 metrics means no one focuses on any of them. Select 10-15 core KPIs that capture the most important dimensions of performance.
- Measuring inputs instead of outcomes: Tracking how many hours the operator worked is less useful than tracking what the plant achieved. Focus on results — compliance margin, energy efficiency, asset availability.
- Ignoring the baseline period: Holding a new contractor to improvement targets before establishing a fair baseline is setting the relationship up for conflict.
- Punishing transparency: If a contractor is penalized for honestly reporting issues, they will stop reporting them. Reward early identification and proactive problem-solving.
- Static targets: KPI targets should evolve as the plant ages, regulations change, and process improvements are implemented. Review and adjust targets annually.
Technology Enablers for Data-Driven O&M
Several technology categories make data-driven O&M management practical and affordable:
- Cloud-based SCADA and monitoring: Eliminates the need for on-premise servers and provides anywhere-access to plant data
- Automated lab analysis: Online analyzers for BOD, COD, TSS, ammonia, and phosphorus provide real-time data instead of 24-48 hour lab turnaround
- Computerized maintenance management (CMMS): Tracks PM schedules, work orders, parts inventory, and equipment history — essential for asset management KPIs
- Automated dosing and control: Automated chemical dosing systems with process feedback provide the control precision needed to optimize chemical efficiency
- Energy monitoring: Submetering on major equipment (blowers, pumps, UV) identifies the largest energy consumers and tracks optimization progress
Getting Started: A 90-Day Implementation Plan
Whether you are launching a new O&M contract or improving an existing one, this 90-day plan provides a practical starting point:
- Days 1-30: Define KPIs, targets, and reporting templates. Install any missing instrumentation needed for data collection. Begin the baseline measurement period.
- Days 31-60: Collect and validate baseline data. Train contractor staff on reporting requirements. Set up dashboard or reporting tools. Hold the first monthly performance review meeting.
- Days 61-90: Finalize baseline values. Identify top 3 improvement opportunities. Develop improvement plans with projected benefits. Implement quick wins. Hold the first quarterly strategic review.
After 90 days, the performance management program should be running smoothly with monthly reports, regular review meetings, and a pipeline of improvement initiatives. The ongoing effort is maintaining discipline — reviewing reports, holding performance discussions, and continuously raising the bar.
Frequently Asked Questions
How many KPIs should a wastewater O&M contract include?
Focus on 10-15 core KPIs that cover all four performance domains: compliance (3-4 KPIs), operational efficiency (3-4 KPIs), asset management (3-4 KPIs), and management/communication (2-3 KPIs). More than 15 creates reporting fatigue and dilutes focus. Fewer than 8 leaves blind spots. Start with the essential KPIs described in this article and adjust based on your facility's specific needs and priorities.
What should I do if my O&M contractor consistently misses KPI targets?
First, verify the targets are reasonable — compare against industry benchmarks and account for any facility-specific constraints (old equipment, unusual influent, etc.). If the targets are fair, request a root cause analysis and a corrective action plan with specific milestones. If performance does not improve within 6 months, escalate to senior management at the contractor's company. Persistent underperformance despite reasonable targets and adequate resources is grounds for contract termination, assuming your agreement includes appropriate provisions.
How do I ensure the data my contractor reports is accurate?
Implement multiple safeguards: (1) install owner-accessible SCADA with read-only access to real-time data; (2) require split samples for laboratory analyses and periodically send samples to an independent lab; (3) conduct unannounced site visits to verify reported conditions; (4) cross-check reported data against utility bills, chemical delivery receipts, and sludge hauling manifests; and (5) include contract provisions that make data falsification grounds for immediate termination. Trust is essential in an O&M relationship, but verification ensures trust is well-placed.
Can small wastewater treatment plants benefit from data-driven O&M management?
Absolutely. Cloud-based monitoring, mobile-friendly dashboards, and affordable online instruments have made data-driven management accessible to plants of any size. A small facility may track fewer KPIs and use simpler tools, but the principles are the same: define what good performance looks like, measure it, and continuously improve. For small plants with part-time operators, automated monitoring with alarm notification is particularly valuable because it provides 24/7 oversight without 24/7 staffing.