Why Paper Mill Wastewater Is a Special Case in Uganda
Uganda hosts roughly 25 active pulp, paper, and tissue mills concentrated in the Jinja, Namanve/Kampala, Mukono, and Mbale industrial corridors, and most are small or medium operations running on virgin kraft, recycled fiber, or mixed furnish. Generic "pulp and paper" guidance from academic journals does not translate because the binding constraint here is the Lake Victoria basin: every kilogram of color and lignin discharged upstream of Lake Victoria travels into a freshwater body that supplies drinking water to over 10 million people, which is why Uganda's National Environment Act 2019 tightened the enforcement arm of NEMA and made color and lignin the headline compliance issues rather than just COD.
The wastewater fingerprint is recognizably paper-mill but locally loaded. Can-Guven et al. (2021, Environmental Progress & Sustainable Energy) report influent COD of 1,500–6,000 mg/L, BOD₅ of 600–2,500 mg/L, TSS of 800–3,000 mg/L, color of 1,500–4,500 Pt-Co units, and pH of 6.5–9.5 for persulfate-treated paper-mill streams; the ScienceDirect PFASC study on recycled-fiber mills lands in the same envelope. Two Uganda-specific factors complicate biology: high-temperature effluent (45–55°C) at mills without heat recovery depresses nitrifier activity and shifts the kinetic window, and lignin-derived chromophores are recalcitrant to conventional activated sludge, so color removal rather than COD is the metric that determines whether a plant passes inspection.
| Parameter | Uganda paper-mill influent (typical range) | Source |
|---|---|---|
| COD | 1,500–6,000 mg/L | Can-Guven et al., 2021 |
| BOD₅ | 600–2,500 mg/L | Can-Guven et al., 2021 |
| TSS | 800–3,000 mg/L | Can-Guven et al., 2021 |
| Color | 1,500–4,500 Pt-Co | Can-Guven et al., 2021; ScienceDirect PFASC, 2018 |
| pH | 6.5–9.5 | Can-Guven et al., 2021 |
| Temperature | 45–55°C (no heat recovery) | HydropureWater field data, 2026 |
Uganda NEMA Effluent Discharge Standards for Paper Mills in 2026
The NEMA National Environmental (Standards for Discharge of Effluent into Water or on Land) Regulations S.I. 153-5 set COD at ≤200 mg/L into water and ≤500 mg/L onto land, BOD₅ at ≤100 mg/L, TSS at ≤100 mg/L, color at ≤50 Pt-Co units, pH at 6.0–9.0, and residual chlorine at ≤1.0 mg/L. These are the numbers an engineer designs against, not a generic "follow local regulations" footnote.
Those limits are technically achievable on the DAF→MBR→tertiary train: the ScienceDirect PFASC study on recycled-fiber mills reported post-treatment COD of 162–198 mg/L and chroma removal of 92–96% on tertiary coagulation with PFASC plus PAM, which sits right at the NEMA water-discharge envelope when paired with an upstream biological stage. Operators carry an annual self-monitoring obligation under the S.I. 153-5 schedule — quarterly composite sampling at the final outfall, pH and residual chlorine logged continuously, and a 12-month record retention for NEMA audits. NEMA inspectors in the Jinja corridor increased spot-checks of small mills in 2024–2025 (per published NEMA enforcement notices), so a defensible compliance file is now a baseline expectation, not a differentiator.
| Parameter | NEMA S.I. 153-5 limit (into water) | Limit (onto land) | Achievable with DAF+MBR+tertiary |
|---|---|---|---|
| COD | ≤ 200 mg/L | ≤ 500 mg/L | 120–180 mg/L |
| BOD₅ | ≤ 100 mg/L | ≤ 200 mg/L | 20–40 mg/L |
| TSS | ≤ 100 mg/L | ≤ 200 mg/L | 10–30 mg/L |
| Color | ≤ 50 Pt-Co | ≤ 200 Pt-Co | 30–55 Pt-Co |
| pH | 6.0–9.0 | 6.0–9.0 | 6.5–8.5 |
| Residual Cl₂ | ≤ 1.0 mg/L | ≤ 1.0 mg/L | < 0.5 mg/L |
The Full Process Train: From Bar Screen to Polished Effluent
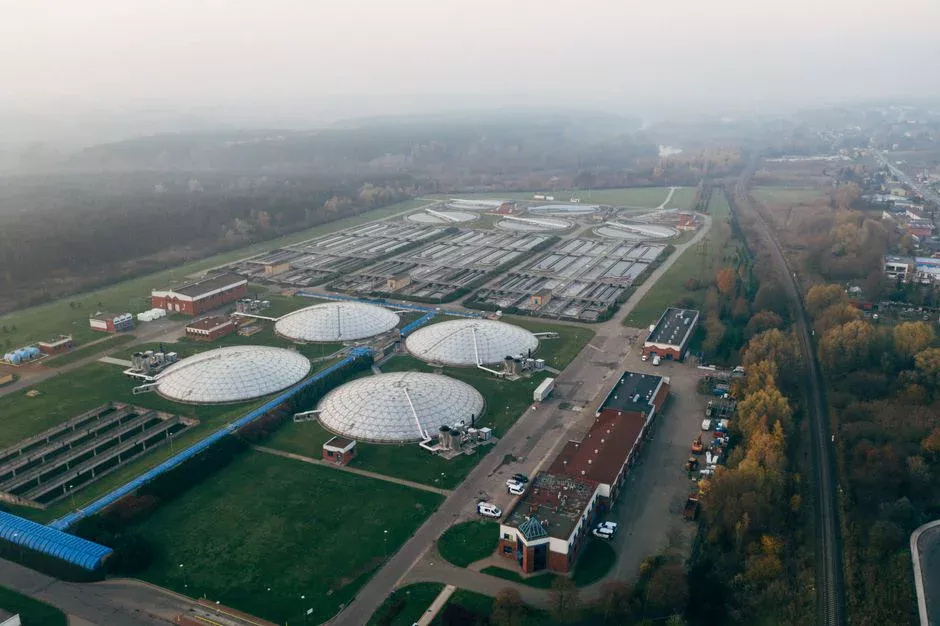
A Uganda paper-mill treatment train runs in six stages, each removing a defined fraction of the load so the next stage sees a feed it can actually handle. Skipping any of them forces the downstream stage to compensate with oversized equipment and higher chemical cost.
Stage 1 — Coarse screening. A GX-series rotary mechanical bar screen with 3–5 mm bar spacing removes fibers, rags, plastics, and broke paper that would otherwise rag up pumps and tear MBR membranes. The GX series is rated for flows of 50–500 m³/h per unit, which covers the typical 20–80 m³/h send-out from a small tissue machine.
Stage 2 — Equalization and primary clarification. A 4–8 h HRT equalization basin smooths flow and temperature swings from pulping campaigns, and a primary clarifier drops settleable solids before they hit the biological stage. Without equalization, a single pulping batch can swing the MBR's food-to-mass ratio by 3× in 30 minutes and trigger a washout.
Stage 3 — Dissolved air flotation. A dissolved air flotation system operating at an A/S ratio of 0.005–0.015 and hydraulic loading of 4–25 m³/m²·h, with 10–50 μm micro-bubbles, removes 60–90% of TSS and 30–50% of COD. DAF outperforms primary clarification for paper-mill suspended solids because fibers and fillers float rather than settle, and the DAF range covers 4–300 m³/h in a single skid, which matches a 500 m³/day mill with one unit and headroom for a second machine.
Stage 4 — Biological stage. An MBR membrane bioreactor system with 0.1 μm PVDF membranes (32–135 m³/day per module) delivers <50 mg/L COD effluent and tolerates the load spikes a paper mill produces during a pulping campaign. MBR's 60% smaller footprint versus conventional activated sludge is decisive on Namanve plots where lease space costs USD 8–15/m²·year.
Stage 5 — Tertiary polishing. Coagulation with PFASC or a polyaluminum chloride blend, plus optional activated carbon for residual color, takes the final effluent to <50 Pt-Co. The ScienceDirect PFASC paper is the benchmark here: 92–96% chroma removal on recycled-fiber feed.
Stage 6 — Sludge dewatering. A plate and frame filter press at 1–500 m² filter area produces a 30–35% dry-solids cake that can be landfilled or sent to a local brick kiln. Uganda has no municipal sludge incineration, so mechanical dewatering is the only credible end-of-pipe option.
Choosing the Right Biological Stage for an East-African Mill
The biological-stage decision is constrained by three Uganda realities: UETCL grid instability, ambient temperatures of 22–32°C in the Jinja/Kampala belt, and a thin operator-skill base. MBR, SBR, and conventional activated sludge all work, but they do not all survive the same set of stresses.
MBR delivers the lowest effluent COD (<50 mg/L), the smallest footprint (typically 60% of an equivalent SBR plot), and the best tolerance to load spikes because the 0.1 μm PVDF membrane holds biomass at 8,000–12,000 mg/L regardless of clarifier upsets — the DF-series MBR module ships with an integrated aeration box that simplifies field installation. The downside is power draw (0.35–0.55 kWh/m³) and membrane replacement every 5–7 years.
SBR and conventional activated sludge cost 25–40% less in CAPEX and draw 0.20–0.30 kWh/m³, which matters where UETCL outages run 4–8 h per week. The trade-off is a 2–3× larger footprint and stricter operator discipline for cycle timing and sludge wasting. Either way, a 20–30% electrical redundancy (diesel genset with automatic transfer switch sized for the aeration basin) is non-negotiable for a paper-mill biological stage in Uganda — Jinja power-quality logs show monthly outage minutes that would crash an unprotected aeration basin within 90 minutes. A PLC-controlled automatic chemical dosing skid reduces operator-skill dependency on the tertiary stage and is a sensible add-on for either route.
| Parameter | MBR (DF series) | SBR | Conventional ASP |
|---|---|---|---|
| Effluent COD | < 50 mg/L | 60–90 mg/L | 80–120 mg/L |
| Footprint (500 m³/d) | ~80 m² | ~180 m² | ~220 m² |
| Power draw | 0.35–0.55 kWh/m³ | 0.20–0.30 kWh/m³ | 0.20–0.28 kWh/m³ |
| Operator skill | Low–medium | Medium–high | Medium |
| Sludge yield | 0.25–0.35 kg/kg COD | 0.35–0.45 kg/kg COD | 0.40–0.50 kg/kg COD |
CAPEX, OPEX, and the Uganda Logistics Premium
A turnkey 500 m³/day paper-mill wastewater plant in Uganda — DAF plus MBR plus tertiary, containerized or skid-mounted — lands at USD 280,000–520,000 in 2026 CAPEX. OPEX runs USD 0.45–0.85 per m³ treated. These are the numbers to put in front of a board, and they are roughly 18–25% higher than an equivalent Indian or Chinese install on a like-for-like basis.
The logistics premium breaks down into four lines that international vendors under-quote: Mombasa port demurrage of USD 80–150 per day per container when pre-shipment documentation is wrong, inland trucking Jinja/Mukono at USD 2,800–3,500 per 40 ft container, URA import-duty structure on skid-mounted plants (18% duty + 18% VAT + 1% withholding on CIF value for HS 8421.21), and an extra 4–6 weeks of commissioning float because the commissioning engineer is on a single-trip visa. The ScienceDirect PFASC circular-economy approach — using steel-mill waste pickling liquor as a tertiary coagulant precursor — is a real cost lever in Uganda because steel pickling liquor is locally available from the Tororo and Kasese steelworks, and buyers should ask vendors whether their tertiary stage is compatible with that feed.
| Cost line | 2026 Uganda figure | Basis |
|---|---|---|
| CAPEX (turnkey 500 m³/d) | USD 280,000–520,000 | HydropureWater field data, 2026 |
| Equipment share | 55% | Standard split |
| Civil works | 15% | Standard split |
| Installation | 12% | Standard split |
| Commissioning | 8% | Standard split |
| Freight + clearing (Mombasa + URA) | 10% | Logistics premium |
| OPEX | USD 0.45–0.85 / m³ | HydropureWater field data, 2026 |
| — Electrical | 0.18–0.30 | UETCL tariff band |
| — Polymer + coagulant | 0.08–0.15 | HydropureWater field data, 2026 |
| — Membrane replacement (amortized) | 0.06–0.12 | 5–7 yr life |
| — Labor | 0.08–0.15 | Uganda wage band |
| — Sludge handling | 0.05–0.13 | Filter press OPEX |
How to Evaluate a Wastewater Equipment Supplier for Uganda
Six weighted criteria separate a credible Uganda-capable vendor from a low-ball quote that arrives in 14 weeks and never commissions. Score each bidder on a 100-point scale.
A vendor 4,000 km away with no East-African agent carries a 30–40% higher total-cost-of-ownership risk in Uganda despite a 10–15% lower headline price, because spare parts take 6–10 weeks to clear Mombasa and a single membrane failure can idle a 500 m³/day mill at USD 800–1,200 per day in lost production. A PLC-controlled automatic chemical dosing skid reduces operator-skill dependency on the tertiary stage, which is the single largest commissioning risk in Uganda. Insist on a 72-h on-site commissioning engineer and a 24-month warranty that explicitly includes membrane integrity testing at months 6, 12, and 18.
| Criterion | Weight | What "good" looks like |
|---|---|---|
| Documented pulp & paper references | 25% | ≥ 3 running mills with name + contact |
| East-African service footprint | 20% | Local agent in Kampala or Nairobi |
| Containerized / skid capability | 15% | Pre-wired, pre-tested in factory |
| Membrane warranty terms | 15% | 24 months, includes integrity test |
| Local-agent spare-parts inventory | 15% | Membranes + pumps on shelf |
| EIA / NEMA approval documentation | 10% | Drafts the EIA chapter for you |
Frequently Asked Questions
What are the 2026 NEMA discharge limits for a paper mill in Uganda? Under S.I. 153-5, COD must be ≤200 mg/L into water, BOD₅ ≤100 mg/L, TSS ≤100 mg/L, color ≤50 Pt-Co, pH 6.0–9.0, and residual chlorine ≤1.0 mg/L. Operators must keep quarterly composite samples for 12 months.
What footprint and timeline should a 500 m³/day paper-mill plant expect in Uganda? A containerized DAF+MBR+tertiary skid train needs roughly 250–350 m² of plot including sludge handling, with a 16–22 week lead time from PO to commissioning (HydropureWater field data, 2026). Add 4–6 weeks if the equipment clears Mombasa during a peak season.
How is paper-mill sludge handled in Uganda with no municipal incineration? Mechanical dewatering on a plate and frame filter press brings the cake to 30–35% dry solids, after which it goes to a licensed landfill or is co-fired in a local brick kiln. Expect 8–15 kg dry solids per 1,000 L of influent.
Is a membrane stage mandatory for a Uganda paper mill, or can conventional activated sludge pass NEMA? Conventional activated sludge can hit COD ≤200 mg/L on a well-controlled system, but struggles to deliver color ≤50 Pt-Co without tertiary coagulation. MBR is the lowest-risk path to full S.I. 153-5 compliance on a single train.