What Makes Fish Processing Wastewater Different
Fish processing wastewater is not a generic food-industry stream — it is a high-strength, high-FOG, highly seasonal effluent that defeats conventional municipal-style activated sludge. Influent COD typically lands between 5,000 and 25,000 mg/L and BOD₅ between 3,000 and 15,000 mg/L, roughly 20–60× stronger than municipal sewage (250–500 mg/L COD). FOG runs 500–3,000 mg/L, total nitrogen 200–800 mg/L, pH 6–9, and temperature 20–35°C; marine-species plants add chloride at 2,000–15,000 mg/L, which knocks out unacclimated biology.
FOG is the signature problem. Conventional activated sludge fails on fish processing wastewater because of hydrophobic sludge bulking, membrane clogging, poor settleability, and aminated odors from protein breakdown — failure modes documented in the Environmental Science and Pollution Research FPWW study that combined BMBBR + UASB + FICCO + CAACO reactors to overcome them (HydropureWater field data, 2026; ESPR fish processing wastewater study, 2024). Total suspended solids (TSS) sit at 1,000–4,000 mg/L, dominated by blood solids, scales, and protein precipitates rather than fibrous plant matter.
Flow is not steady. Cannery, surimi, and fishmeal plants spike during harvest months — menhaden season, tuna runs, pollock A-season — when peak daily flow can hit 3–4× the dry-season average. Any plant without equalization and modular biological capacity will wash out biomass during those weeks. If a supplier quotes a single-train activated-sludge system with no DAF upfront, they have not designed for this stream. For related food-industry nitrogen design context, see this nitrogen removal process comparison for food wastewater.
The Standard Process Train in 2026
A turnkey fish processing wastewater treatment plant in 2026 is a six-stage train. Each stage has a defensible engineering target, and any supplier quote that skips a stage should trigger a technical clarification.
- Preliminary treatment. A rotary mechanical bar screen for preliminary treatment with 3–5 mm openings, followed by a grit chamber, protects downstream pumps from fish bones, scales, shells, and packaging debris. Expect 10–20% TSS reduction and nearly all gross solids capture here.
- Dissolved air flotation (DAF) for FOG. Operate at air-to-solids ratio (A/S) of 0.02–0.08 and surface hydraulic loading of 5–15 m³/m²·h. A properly sized dissolved air flotation system for FOG removal delivers 80–95% FOG and 50–70% TSS removal in a single step — this is the single highest-impact unit operation in the train and the one that makes downstream biology feasible.
- Flow equalization. Size for 8–24 hours HRT to absorb harvest-season surges and dampen shock loads from batch cooking, thawing, or CIP cleaning cycles. Without equalization, biomass in the next stage sees pH and COD swings of 2–3× within a single shift.
- Biological treatment. Two mainstream 2026 options. Anaerobic (UASB or IC) for plants with influent COD >2,000 mg/L and operators willing to capture biogas; or aerobic MBR/MBBR for smaller or lower-strength sites that need a tight discharge envelope. An MBR membrane bioreactor for final biological polishing typically delivers COD <50 mg/L, NH₃-N <5 mg/L at <1 µm membrane cutoff.
- Sludge dewatering. Fish sludge is high-protein and odorous — dewater within 24 hours of thickening using a plate and frame filter press for fish sludge dewatering to reach 22–28% dry solids for off-site disposal or rendering.
- Disinfection. A chlorine dioxide generator for effluent disinfection is preferred over chlorine because ammonia in the effluent consumes free chlorine and drives trihalomethane (THM) formation; ClO₂ dose of 2–5 mg/L achieves 0.2–0.5 mg/L residual with no THM penalty. UV at 30–40 mJ/cm² is the standard polish step for water-reuse loops.
| Stage | Unit Operation | Primary Target | Typical Removal |
|---|---|---|---|
| 1 | Bar screen + grit | Gross solids, bones, scales | 10–20% TSS, ~100% debris >3 mm |
| 2 | DAF | FOG, colloidal TSS | 80–95% FOG, 50–70% TSS |
| 3 | Equalization basin | Flow + load dampening | 8–24 h HRT buffer |
| 4 | UASB or MBR/MBBR | Soluble COD, ammonia | 85–99% COD, 90–98% NH₃-N |
| 5 | Plate-and-frame press | Sludge volume reduction | 22–28% DS cake |
| 6 | ClO₂ + UV | Pathogen control | >99.9% coliform, 0.2–0.5 mg/L ClO₂ residual |
Performance Benchmarks Buyers Should Demand
Use the table below as the reference benchmark for any seafood wastewater treatment plant proposal. If a supplier's guaranteed effluent numbers fall outside these ranges without a written engineering justification, push back or walk away.
| Parameter | Raw Influent | After DAF | After Biological | Final Effluent (MBR) |
|---|---|---|---|---|
| COD (mg/L) | 5,000–25,000 | 3,000–15,000 | 150–500 | ≤50 |
| BOD₅ (mg/L) | 3,000–15,000 | 2,000–9,000 | 30–150 | ≤20 |
| TSS (mg/L) | 1,000–4,000 | 300–1,200 | 20–60 | ≤10 |
| FOG (mg/L) | 500–3,000 | 50–300 | 10–40 | ≤10 |
| Total nitrogen (mg/L) | 200–800 | 180–700 | 10–30 | ≤15 (NH₃-N ≤5) |
| Total phosphorus (mg/L) | 20–80 | 15–60 | 2–8 | ≤2 |
| pH | 6.0–9.0 | 6.5–8.5 | 6.8–7.8 | 6.5–8.5 |
The combined biological train — when properly designed — achieves 99 ± 0.1% COD and 99% protein removal, as documented in the multi-reactor (BMBBR + UASB + FICCO + CAACO) FPWW configuration (ESPR fish processing wastewater study, 2024). In a commercial MBR plant, expect the MBR membrane bioreactor module to deliver consistent COD below 50 mg/L with transmembrane pressure held under 0.3 bar at flux of 15–20 L/m²·h.
Supplier Selection Matrix: How to Compare Vendors in 2026
Most Alibaba and Made-in-China listings for fish processing WWTP sell one or two unit operations — a DAF skid here, an MBR skid there — and leave the buyer to integrate. A turnkey fish processing wastewater treatment plant supplier should cover preliminary + DAF + biological + sludge + disinfection as one integrated train with single-point accountability. Score shortlisted vendors on the following matrix.
| Criterion | Weight | What to Look For | Red Flag |
|---|---|---|---|
| Process scope | 25% | Full train: screening → DAF → equalization → biological → sludge → disinfection | DAF-only or MBR-only supplier with no integration |
| Seafood reference list | 20% | 2–3 fish/seafood case studies with flow rate, influent, effluent data | Generic food or slaughterhouse references only |
| Certifications | 15% | ISO 9001; CE for EU; ASME for pressure vessels; familiarity with EU 91/271/EEC and EN 12255 series | No ISO documentation, no CE where required |
| Engineering deliverables | 15% | GA drawings, P&ID, electrical schematics, O&M manual, written influent/effluent guarantees | "Standard model, no customization" answer |
| After-sales | 15% | ≥12-month warranty, on-site commissioning, English-speaking engineer, 48 h spare-parts from regional warehouse | Warranty only on paper, no regional parts |
| Lead time | 10% | 8–14 weeks for containerized skid; 16–28 weeks for civil-tied plant | Vague "60–90 days" with no engineering schedule |
For a defensible 2026 shortlist, apply the framework in the supplier selection framework for 2026 and request the same five documents (GA, P&ID, schematics, O&M, performance guarantee) from every vendor before any commercial comparison.
2026 CAPEX and OPEX Breakdown
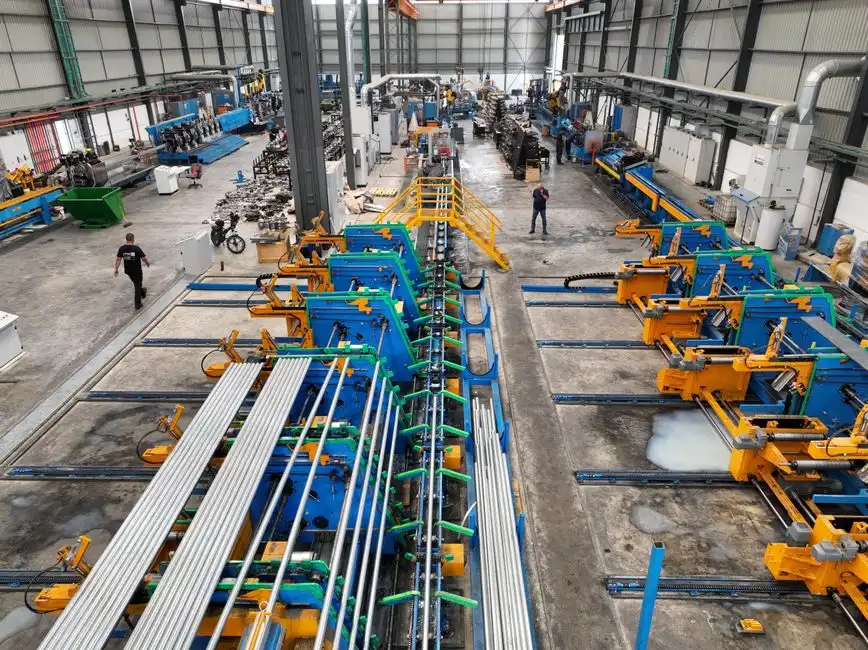
Use the bands below to build a defensible budget envelope. Stripped-down packaged units listed on Made-in-China at $4,100–$13,000 per set are typically primary clarifier + biological + sludge holdup with no DAF and no disinfection polish — they should not be compared apples-to-apples with a full fish-processing train (Made-in-China listing data, 2026-01).
| Plant Capacity | Configuration | CAPEX Range (USD) | OPEX ($/m³) |
|---|---|---|---|
| 50 m³/day | Containerized skid, DAF + MBR + ClO₂ | $120,000–$280,000 | $0.35–$0.45 |
| 200 m³/day | Skid + light civil, DAF + UASB + MBR + ClO₂ | $350,000–$800,000 | $0.22–$0.35 |
| 500 m³/day | Full civil build, DAF + UASB + MBR + UV | $900,000–$1,800,000 | $0.18–$0.28 |
| 1,000–2,000 m³/day | Multi-line civil, IC anaerobic + MBR + UV + biogas utilization | $2,000,000–$3,500,000 | $0.18–$0.25 |
OPEX is dominated by aeration (MBR blower duty 0.4–0.6 kWh/m³), chemical dosing for DAF (coagulant + polymer, $0.02–$0.05/m³), and sludge hauling at $80–$150 per ton wet cake (HydropureWater field data, 2026). A $1.5M plant on a 500 m³/day cannery line pays back in 3–5 years at $2–$4/m³ avoided discharge cost plus biogas revenue if an anaerobic train is selected. Detailed pricing methodology is in the 2026 wastewater treatment plant cost benchmarks.
Regional Compliance Targets You Must Hit
Specifying a plant that does not meet local discharge limits is the single most expensive procurement error — it delays commissioning by 6–12 months and forces retrofits. Lock the discharge envelope before signing the PO.
| Region | Regulation | COD (mg/L) | BOD (mg/L) | FOG (mg/L) | NH₃-N (mg/L) |
|---|---|---|---|---|---|
| United States | EPA 40 CFR Part 408 — Fish Processing Point Source Category | Subcategory-specific BPT/BAT/BCT | Subcategory-specific | Subcategory-specific | Site permit-driven |
| European Union | 91/271/EEC + Food, Drink and Milk BREF (2019) | ≤125 (general) | ≤25 | ≤15 (industry BAT-AEL) | ≤10 (sensitive areas) |
| Vietnam | QCVN 11-MT:2015/BTNMT | ≤80 (surface water) | ≤40 | ≤10 | ≤8 |
| Indonesia | Permen LH No. 5/2014 | ≤100 | ≤50 | ≤15 | ≤10 |
| China (domestic) | GB 21904-2008 + local food-industry standards | ≤100 (fishmeal plants tighter) | ≤30 | ≤10 | ≤10 (fishmeal ≤5) |
For African and Central Asian destination markets, also cross-check the regional COD discharge limits reference and the ammonia nitrogen discharge limit in Kazakhstan 2026 standards guide — the same MBR skid passes in some jurisdictions and fails in others based solely on the limit table.
Frequently Asked Questions
What COD reduction should a fish processing wastewater treatment plant guarantee in 2026?
At least 95% overall COD reduction, from a 5,000–25,000 mg/L influent down to ≤250 mg/L for a UASB-based train, or ≤50 mg/L if an MBR polish step is included. Reference biological trains in published FPWW studies reach 99 ± 0.1% COD removal across a multi-reactor series.
How do I shortlist a fish processing wastewater treatment plant supplier?
Score each vendor on the six-criterion matrix (process scope, seafood references, certifications, engineering deliverables, after-sales, lead time) and reject any supplier that cannot provide 2–3 seafood-specific case studies with measured influent and effluent data, written performance guarantees, and a 48-hour spare-parts commitment from a regional warehouse. See the supplier selection framework for 2026.
What CAPEX should I budget for a turnkey fish processing wastewater treatment plant in 2026?
Between $120,000 for a 50 m³/day containerized cannery line and $3,500,000 for a 2,000 m³/day surimi or fishmeal plant, with OPEX of $0.18–$0.45 per m³ depending on aeration, chemical, and sludge-h hauling cost. See the 2026 wastewater treatment plant cost benchmarks for line items.
How is FOG removed most effectively from fish processing wastewater?
A dissolved air flotation system for FOG removal operated at air-to-solids ratio 0.02–0.08 and surface loading 5–15 m³/m²·h achieves 80–95% FOG removal in a single stage, which is what makes downstream MBR or UASB biology viable on fish effluent.
Which biological reactor is best for a 500 m³/day fishmeal plant?
An anaerobic UASB or IC reactor upstream of an MBR membrane bioreactor for final biological polishing, with coagulant and polymer dosed via an automatic chemical dosing system ahead of the DAF — this combination handles 10,000–25,000 mg/L influent COD and produces ≤50 mg/L final effluent.