What Wet Etching Wastewater Actually Is — and Why It Defeats a Municipal Plant
Wet etching wastewater is the spent rinse and bath liquor from chemical etching operations used in PCB, MEMS, semiconductor, and solar cell manufacturing. It typically contains 500–5,000 mg/L fluoride (F⁻), 50–800 mg/L copper, 100–2,000 mg/L ammonia nitrogen, and 200–3,000 mg/L COD. Treatment is a four-stage train: alkaline neutralization, CaF2 precipitation, ammonia stripping or breakpoint chlorination, and ion exchange or reverse osmosis polishing to meet 2026 discharge limits such as China GB 39731-2025, EU IED 2010/75/EU, and US EPA 40 CFR 433.
Four chemical families dominate the stream. HF/HNO₃ etchants (used for silicon dioxide and glass) and NH₄F-based etchants (used for silicon nitride in MEMS and photovoltaic lines) are the main F⁻ carriers — Choi et al. (2024) note HF as the dominant chemistry in eco-friendly glass wet etching for MEMS, with F⁻ loads that exceed anything a biological plant can absorb. CuSO₄ and CuCl₂ ammoniacal etchants (for PCB through-holes and inner layers) bring 50–800 mg/L Cu²⁺ plus 100–2,000 mg/L NH₃-N at pH 8–10. Rinse-water dilution typically drops the bulk pH to 0.5–4 and COD to 200–3,000 mg/L from complexing agents (EDTA, citrate, ammonia) and surfactants.
A municipal WWTP fails this stream for three reasons. Free F⁻ above 30 mg/L corrodes concrete reactor walls and inverts nitrification; free ammonia above 100 mg/L is acutely toxic to nitrifying bacteria (EC₅₀ ≈ 8 mg/L NH₃ on Nitrosomonas, per standard aquatic toxicology references); and Cu²⁺ above 1–2 mg/L inactivates activated-sludge flocs. Tanker-off-site disposal is permitted in a few jurisdictions but loses cost advantage above 20 m³/day. On-site treatment is effectively mandatory for any fab above that flow. 2026 also marks the first full enforcement year of China's GB 39731-2025 semi-industry water pollutant standard, which tightens F⁻ and ammonia limits versus the older GB 8978-1996 — a driver pushing more lines to on-site polishing rather than discharge. Engineers sizing biological polishing for COD can refer to COD removal methods for chemical wastewater for downstream biological load projections.
The 2026 Compliance Targets You Will Be Measured Against
China GB 39731-2025 (electronic semi-industry water pollutant standard, effective 1 March 2025, with 2026 transition for legacy lines) sets the tightest published F⁻ target for electronics: F⁻ ≤10 mg/L, total Cu ≤0.3 mg/L, NH₃-N ≤15 mg/L, COD ≤50 mg/L, TN ≤30 mg/L. These are the numbers a Chinese fab will be measured against during a 2026 inspection.
US EPA 40 CFR Part 433 (Metal Finishing) is the categorical standard for PCB and electronics surface-treatment lines discharging to a POTW: total Cu 2.68 mg/L daily max / 1.71 mg/L monthly average, total F⁻ 48 mg/L daily max, with NH₃-N governed by the local POTW's narrative criteria. Direct-discharge lines instead follow 40 CFR 430 (Pulp, Paper and Paperboard) is irrelevant; electronics direct discharges are typically under site-specific NPDES permits with technology-based limits from 40 CFR 433. EU IED 2010/75/EU plus the 2024 BAT-AEL update for surface treatment of metals and plastics sets total Cu ≤0.4 mg/L and F⁻ ≤10 mg/L in integrated wastewater discharge. Taiwan EPA effluent standards cap F⁻ at 15 mg/L; South Korea's electronics trend is moving process-water reuse toward sub-1 mg/L F⁻.
| Standard | Region | F⁻ (mg/L) | Cu total (mg/L) | NH₃-N (mg/L) | COD (mg/L) |
|---|---|---|---|---|---|
| GB 39731-2025 | China (electronic semi-industry) | ≤10 | ≤0.3 | ≤15 | ≤50 |
| 40 CFR 433 (daily max) | US (POTW discharge) | ≤48 | ≤2.68 | per POTW | per POTW |
| IED 2010/75/EU + 2024 BAT-AEL | EU (integrated discharge) | ≤10 | ≤0.4 | case-specific | case-specific |
| Taiwan EPA effluent | Taiwan | ≤15 | ≤3.0 | ≤30 | ≤100 |
Use this table to pre-screen any vendor claim. A system quoted as "RO polishing for rinse-water reuse" should be specified against the tightest applicable row, not the loosest.
The Four-Stage Treatment Train: Neutralization → Precipitation → Polishing → Reuse
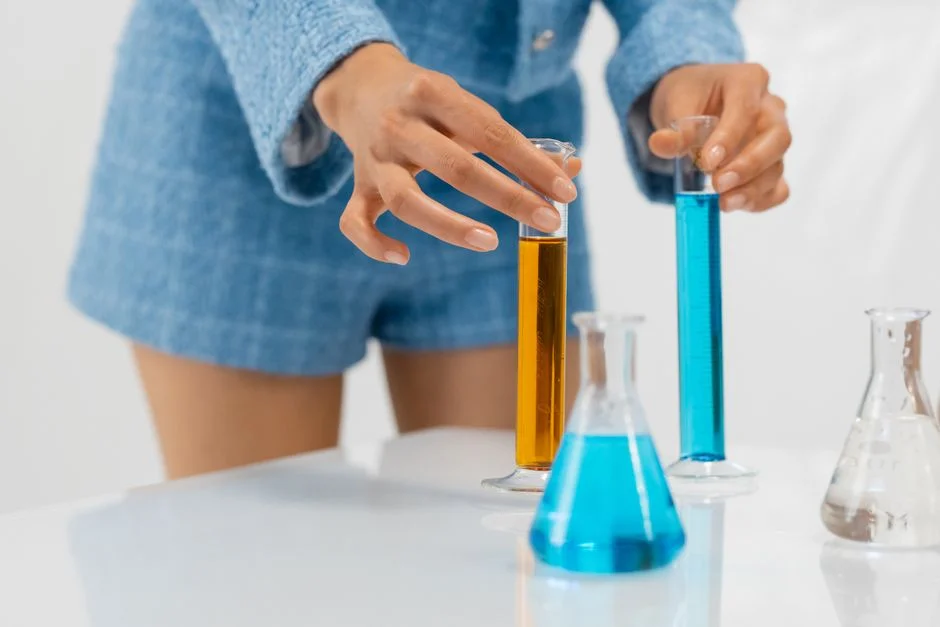
Stage 1 — Equalization and alkaline neutralization. A 24-h equalization tank with mechanical mixing dampens the spikes that are normal in fab effluent (etch baths dump at pH <1; rinse lines run near pH 7). Lime or Ca(OH)₂ is dosed to pH 9–10. All wetted parts — tanks, pipes, pumps, valves — must be HF-resistant: FRP with vinyl-ester resin, PVDF, or HDPE. 304/316 stainless fails in months on HF service. A PLC-controlled Ca(OH)2 and CaCl2 dosing loop is the cheapest insurance against pH drift, which is the single most common cause of F⁻ breakthrough downstream.
Stage 2 — CaF₂ precipitation and co-precipitation of heavy metals. Two-stage Ca(OH)₂ + CaCl₂ dosing drives F⁻ to <15 mg/L and Cu to <1 mg/L in a 30–60 min reaction, then a lamella clarifier for CaF₂ precipitation (or a DAF unit for fine CaF₂ flotation when the stream carries complexing agents) thickens the sludge to 2–4% solids. CaF₂ Ksp ≈ 3.9 × 10⁻¹¹ at 25 °C; co-precipitation with Cu(OH)₂ at pH 9.0–9.5 captures >99% of both. Reaction time matters more than dose: 20 min gives ~85% F⁻ removal, 60 min gives >95%.
Stage 3 — Ammonia removal. Air stripping at pH 11, 35–45 °C, with 1,500–2,000 m³ air per m³ water drops NH₃-N from 1,500 to <50 mg/L. For tighter polishing, breakpoint chlorination at Cl₂:NH₃-N mass ratio of about 9:1 oxidizes the residual NH₃-N to N₂ and pushes the outlet below 5 mg/L — but be aware that chlorine demand rises sharply with any residual organics. MBBR nitrification-denitrification is viable only for streams already below ~200 mg/L NH₃-N, which means it sits after one of the above rather than as a primary step.
Stage 4 — Polishing for reuse. Strong-base anion exchange brings F⁻ to <1 mg/L for process-rinse recovery; reverse osmosis recovers 70–85% of the water as reuse-quality permeate with 95–99% salt rejection. A small activated-carbon guard absorbs residual complexing agents that would otherwise foul the RO membrane. RO polishing for rinse-water reuse is the dominant reuse path in 2026 new builds.
| Stage | Influent F⁻ (mg/L) | Effluent F⁻ (mg/L) | Influent Cu (mg/L) | Effluent Cu (mg/L) | Influent NH₃-N (mg/L) | Effluent NH₃-N (mg/L) | Chemical dose |
|---|---|---|---|---|---|---|---|
| 1. Equalization + neutralization | 500–5,000 | 500–5,000 (pH 9–10) | 50–800 | 50–800 (precipitated) | 100–2,000 | 100–2,000 | 0.6–1.2 kg Ca(OH)₂/m³ |
| 2. CaF₂ precipitation + clarifier | 500–5,000 | <15 | 50–800 | <1 | 100–2,000 | 100–2,000 | + 0.3–0.5 kg CaCl₂/m³ |
| 3. Stripping / breakpoint Cl₂ | <15 | <15 | <1 | <0.5 | 100–2,000 | <15 (Cl₂) / <50 (strip) | Cl₂:NH₃-N ≈ 9:1 |
| 4. Anion exchange / RO | <15 | <1 | <0.5 | <0.05 | <15 | <5 | — |
How to Choose Between Precipitation, Ion Exchange, RO, and Evaporative Crystallization
The decision is driven by four numbers: daily flow, F⁻ load, water-scarcity index, and whether the fab wants ZLD or just compliance discharge. A simple flow: <20 m³/day with tight rinse-water reuse → strong-base ion exchange; 20–200 m³/day with reuse → RO polishing; >200 m³/day or mandated zero-liquid-discharge electronics sites → evaporative crystallization for the final 5–10% brine.
Precipitation is the workhorse and the cheapest step, but it produces 3–6 kg CaF₂ sludge per m³ of feed (HydropureWater field data, 2026) — sludge disposal is therefore the second-largest OPEX line after chemicals. Ion exchange is compact (footprint roughly one-third of an equivalent RO train) but generates a HF-rich regenerant that has to be recycled back to the precipitation stage. RO gives 70–85% permeate recovery with F⁻ scaling risk controlled by antiscalant and feed pH 5.5–6.5; membrane replacement is the recurring capex. Evaporative crystallization is the only option that hits true zero liquid discharge electronics targets, at 60–80 kWh/m³ electrical and a thermal multiplier of 0.3–0.5 ton steam/m³ for mechanical-vapor-recompression systems.
A typical 2026 build pairs CaF₂ precipitation → DAF sludge thickener → RO, and only adds crystallization at the final 5–10% brine stage if local water prices exceed USD 2/m³ or discharge is prohibited. RO polishing for rinse-water reuse handles the bulk; a side-stream MBR module is sometimes added for COD polishing of the RO concentrate before crystallization.
| Option | Best flow range | Water recovery | Sludge / waste | Energy | When to pick it |
|---|---|---|---|---|---|
| CaF₂ precipitation only | any | none (discharge) | 3–6 kg CaF₂/m³ | 0.1 kWh/m³ | First stage, mandatory |
| Strong-base anion exchange | <20 m³/day | >95% as rinse | HF regenerant recycle | 0.3 kWh/m³ | Small fab, tight F⁻ <1 mg/L |
| Reverse osmosis | 20–200 m³/day | 70–85% permeate | 15–30% concentrate | 0.8–1.6 kWh/m³ | Reuse required, mid-size fab |
| Evaporative crystallization (MVR) | >200 m³/day or ZLD | >99% (ZLD) | salts, no liquid | 60–80 kWh/m³ | Zero discharge mandated, water-scarce |
2026 CAPEX and OPEX Benchmarks for a 50 m³/day System
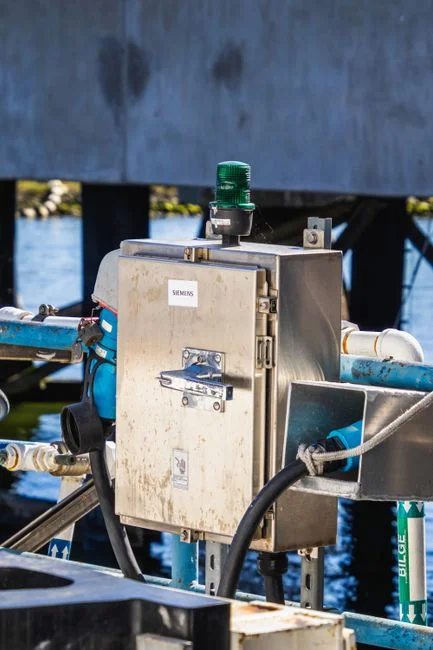
A 50 m³/day turnkey wet etching wastewater plant lands at USD 280K–620K for a skid-mounted build or USD 480K–1.1M for a containerized civil build (HydropureWater field data, 2026). The two largest cost drivers are F⁻-resistant materials (PVDF/FRP rather than PP or stainless) and RO membrane area, which scales with feed TDS and target recovery.
OPEX per cubic meter of treated effluent: 0.6–1.2 kg Ca(OH)₂, 0.3–0.5 kg CaCl₂, 0.8–1.6 kWh electrical, and CaF₂ cake disposal at USD 80–180/ton (60% moisture). Total OPEX sits at 0.55–1.30 USD/m³, with chemicals and sludge together accounting for 55–65% of the recurring bill. A plate-and-frame press for CaF₂ cake drops the cake to 60% moisture and is the most economic dewatering choice for this sludge; a baghouse on the lime silo keeps airborne lime below the 5 mg/m³ occupational limit during bag-changing.
The cost of getting it wrong: a single F⁻ exceedance above 50 mg/L under GB 39731-2025 enforcement can trigger RMB 100K–1M fines plus a 3–7 day production-line shutdown, which on a 50 m³/day fab is roughly USD 50K–200K of lost throughput. Engineers should compare this to the OPEX line above before trimming polishing-stage equipment.
Common Design Mistakes and How to Avoid Them
Under-sizing equalization is the most common cause of F⁻ breakthrough. HF etchant dumps are spiky — a single 1 m³ bath dump into a 10 m³ equalization tank can swing pH from 9 to <2 in 20 minutes and break downstream CaF₂ precipitation. Specify 24 h retention at peak flow. Second, wrong clarifier choice: a conventional center-feed settling tank loses 30–40% of fine CaF₂ solids to the overflow; a lamella clarifier for CaF₂ precipitation or a DAF unit for fine CaF₂ flotation recovers the fines and stabilizes effluent F⁻. Third, skipping sludge dewatering: CaF₂ cake is gelatinous and demands lime conditioning plus a plate-and-frame press for CaF₂ cake; decanter centrifuges alone leave 80–85% moisture and balloon disposal cost. Fourth, manual Ca(OH)₂ dosing cannot hold the ±0.2 pH window that drives F⁻ below 10 mg/L; PLC-controlled Ca(OH)₂ and CaCl₂ dosing with pH feedback is mandatory, not optional.
Frequently Asked Questions
What is the 2026 China F⁻ discharge limit for PCB fabs? GB 39731-2025 caps F⁻ at 10 mg/L for the electronic semi-industry category, with a 2026 transition year for legacy lines coming off GB 8978-1996.
How much Ca(OH)₂ is needed to treat 1 m³ of HF wastewater at 2,000 mg/L F⁻? Stoichiometry plus 10–20% excess gives 0.6–1.2 kg/m³ Ca(OH)₂, with an additional 0.3–0.5 kg/m³ CaCl₂ to push the reaction past 95% F⁻ removal.
Can wet etching wastewater go to a municipal plant? No, not past 20 m³/day: F⁻ above 30 mg/L corrodes concrete, free ammonia is acutely toxic to nitrifiers, and Cu²⁺ inactivates activated sludge. On-site treatment is mandatory in most jurisdictions.
What is the cheapest polishing option for F⁻ below 1 mg/L? Strong-base anion exchange at flows below 20 m³/day, and reverse osmosis at 20–200 m³/day — see the RO polishing for heavy-metal removal guide for sizing detail.
What does a 50 m³/day wet etching wastewater system cost in 2026? USD 280K–620K CAPEX (skid-mounted) or USD 480K–1.1M (containerized civil build), with OPEX of 0.55–1.30 USD/m³. Engineers cross-checking heavy-metal limits should also review the 2026 heavy-metal discharge limits cheat sheet; for downstream biological polishing of RO concentrate, the MBR + ClO₂ hospital-wastewater blog gives reuse-context design numbers.