What Makes Beverage Wastewater Different from Municipal Effluent
Beverage plant effluent is a high-strength, sugar-rich stream that does not fit municipal design envelopes. Raw influent typically runs COD 1,500–8,000 mg/L and BOD₅ 800–5,000 mg/L, with a BOD/COD ratio of 0.5–0.7 — far above the 0.3–0.4 ratio seen in chemical or refinery wastewater, and a direct consequence of dissolved sucrose, fructose, and starch carryover from product. Flow is not steady: clean-in-place (CIP) discharges of caustic NaOH (1–3% w/w) and nitric or phosphoric acid push instantaneous loads 3–5× above daily average, and pH swings between 2 and 12 inside a single shift are routine. Pollutant categories include simple sugars, fruit pulp, colorants, and CIP surfactants, plus thermal loads of 35–55°C from bottle and filler rinses. The 2026 compliance target the rest of this article references is the EU Industrial Emissions Directive 2010/75/EU BAT-AEL of COD <250 mg/L for direct discharge to surface water, paired with WHO and EPA reuse guidelines for any stream sent to CIP, cooling, or boiler feed.
| Parameter | Beverage Influent (typical) | Municipal Influent (typical) | 2026 Discharge Limit |
|---|---|---|---|
| COD (mg/L) | 1,500–8,000 | 250–600 | <250 (EU BAT-AEL) |
| BOD₅ (mg/L) | 800–5,000 | 150–350 | <100 (typical consent) |
| TSS (mg/L) | 300–1,500 | 150–400 | <60 (EU BAT-AEL) |
| FOG (mg/L) | 200–800 | 30–80 | <15 (sewer) |
| pH | 2–12 (batch) | 6.5–8.0 | 6.0–9.0 |
| Temperature (°C) | 25–55 | 10–25 | <40 (consent) |
The Five-Stage Beverage Wastewater Treatment Process
A defensible beverage wastewater treatment process for a soft-drink, juice, brewery, or bottling plant chains five unit operations. Each stage has a defined influent and effluent envelope, and each has a costed equipment line item that procurement will recognize.
Stage 1 — Screening. A GX series rotary mechanical bar screen at 5–10 mm aperture removes gross solids (bottle caps, label fragments, fruit skins) before flow enters the wet well. Screening cuts 60–80% of settleable solids and protects downstream pumps and membranes from ragging. Two-duty/one-standby configuration is standard for plants above 500 m³/day.
Stage 2 — Dissolved air flotation. A dissolved air flotation (DAF) system at hydraulic loading 15–25 m³/m²/h and air-to-solid ratio 0.005–0.02 kg air/kg TSS strips 90–95% of FOG and TSS in a single pass (HydropureWater field data, 2026). DAF is non-negotiable for beverage streams because free and emulsified oils from syrup rooms coat biological floc and crush MBR flux within days if not removed upstream.
Stage 3 — Equalization. An 8–24 hour equalization basin damps CIP spikes; sizing below 8 hours leaves the biological stage exposed to organic shocks that lift effluent COD above 100 mg/L for 24–48 hours. pH correction to 6.5–7.5 is handled by a PLC-controlled chemical dosing skid dosing NaOH or H₂SO₄ on a PID loop from the basin pH probe.
Stage 4 — Biological reactor. An integrated MBR membrane bioreactor operating at MLSS 8,000–12,000 mg/L and HRT 8–14 hours removes 95–98% of COD, dropping influent 1,500–8,000 mg/L to <50 mg/L effluent. MBR replaces the conventional activated sludge + clarifier combination and cuts plant footprint by roughly 60%.
Stage 5 — Tertiary and reuse. A multi-media filter polishes mixed liquor carryover to <3 NTU; an industrial RO system at 75–95% recovery then produces reuse-grade water for CIP, cooling-tower make-up, or low-pressure boiler feed.
| Stage | Key Equipment | Design Parameter | Influent → Effluent | Removal |
|---|---|---|---|---|
| 1. Screening | Rotary bar screen | 5–10 mm aperture | Gross solids removal | 60–80% settleable |
| 2. DAF | DAF unit | 15–25 m³/m²/h | 1,500 mg/L TSS → <150 mg/L | 90–95% FOG, TSS |
| 3. Equalization | EQ basin + dosing | 8–24 h HRT | pH 2–12 → 6.5–7.5 | Load damping |
| 4. MBR | Membrane bioreactor | MLSS 8,000–12,000 mg/L | COD 1,500–8,000 → <50 mg/L | 95–98% COD |
| 5. RO | Multi-media + RO | 75–95% recovery | <50 mg/L → <5 mg/L COD | Reuse-grade |
Choosing the Core Biological Reactor: MBR vs MBBR vs SBR
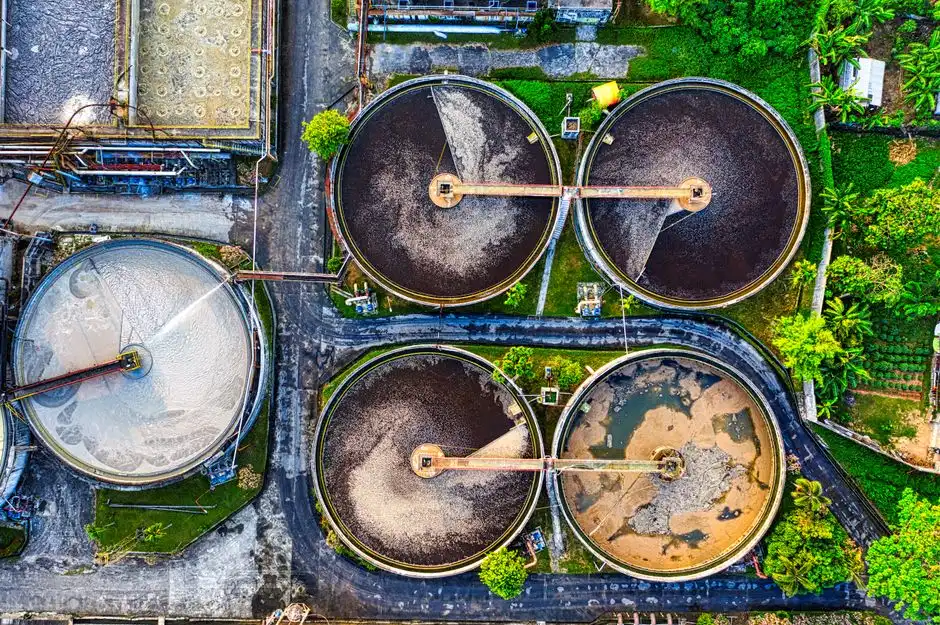
The biological stage carries the largest CAPEX line and the longest operating risk, so the choice needs to be defensible on paper before it goes to procurement. The comparison below covers the three reactors plant engineers most often weigh for bottling plant ETP work, with a 100 m³/day reference frame (HydropureWater engineering data, 2026).
| Criterion | MBR | MBBR | SBR |
|---|---|---|---|
| Effluent COD | <50 mg/L | 60–100 mg/L | 60–80 mg/L |
| Effluent TSS | <1 mg/L | 20–30 mg/L | 15–25 mg/L |
| Footprint (rel.) | 0.4× CAS | 0.6× CAS | 1.0–1.2× CAS |
| Energy (kWh/m³) | 0.4–0.6 | 0.2–0.35 | 0.15–0.25 |
| CAPEX (100 m³/d) | Highest | Medium | Lowest |
| Membrane replace. | Every 5–7 yr | None | None |
| Operator skill | Medium | Low | High |
MBR is the right answer when the project targets reuse or any discharge consent tighter than 100 mg/L COD; an integrated MBR membrane bioreactor ships with the membrane cassette pre-mounted, cutting civil work to a single basin. For an MBR cost benchmark in a comparable high-COD stream, see our MBR cost benchmark for sugar mill wastewater, and for membrane selection see flat sheet MBR membrane for food processing.
MBBR is cost-defensible for plants discharging to municipal sewer at <250 mg/L COD, where the looser effluent envelope lets the operator skip membranes. MBBR tolerates the 3–5× hydraulic and organic shock from CIP batches better than MBR, and the absence of membrane CIP chemicals reduces OPEX volatility.
SBR remains the lowest CAPEX option for plants below 200 m³/day with a stable influent and an attentive operator crew; batch flexibility is a real advantage when CIP discharges arrive on a known schedule. Footprint penalty (typically 20–40% larger than MBR) and longer HRT (16–24 h) are the trade-offs. The decision rule: choose MBR for reuse or strict discharge <50 mg/L COD; choose MBBR for cost-sensitive sites with sewer discharge at <250 mg/L; choose SBR for plants <200 m³/day with skilled operators and stable influent.
Sludge Handling and Chemical Dosing in Beverage Plants
Two line items are routinely under-budgeted in beverage ETP capex tables: the sludge dewatering train and the CIP chemical handling. DAF skimmings combined with biological waste activated sludge produce 0.3–0.8 kg dry solids per cubic meter of treated wastewater, and that material must leave the site at <75% moisture to be acceptable to most off-site disposal contractors. A plate-and-frame filter press dewatered at 6–8 bar reaches 22–28% DS and scales from 1 m² to 500 m² filtration area to match plant size; a decanter centrifuge is the alternative above 1,000 m³/day where continuous operation outweighs the lower cake dryness.
Polymer conditioning at 3–8 g/kg DS is dosed from a PLC-controlled chemical dosing skid — this matches the dosing skid already used upstream for pH correction, and consolidating the procurement order keeps spare-parts inventory lean. For plants co-located with a brewery, dairy, or food-processing neighbor, consider an anaerobic co-digestion step that captures biogas at 0.25–0.40 m³ CH₄ per kg VS destroyed; this converts a disposal cost into a heat-recovery line item. Sedimentable carryover upstream of the filter press is best captured in a high-efficiency sedimentation tank, which also acts as a buffer during filter-press maintenance windows.
2026 CAPEX and OPEX Benchmarks for Beverage WWTP
Procurement will ask for a single-page cost table, so the ranges below are sized by daily treatment capacity and bundle equipment, civil work, and commissioning. Figures are drawn from beverage and food-plant analogues in HydropureWater's 2025–2026 project pipeline; site-specific factors (soil, power tariff, discharge consent) can move a project ±25%.
| Plant Capacity | CAPEX Range (USD) | OPEX (discharge) | OPEX (reuse) | Indicative Payback |
|---|---|---|---|---|
| 100 m³/day | $0.25M – $0.6M | $0.65 – $0.95/m³ | $1.00 – $1.40/m³ | 3–4 years (reuse) |
| 500 m³/day | $0.6M – $2.4M | $0.40 – $0.70/m³ | $0.70 – $1.10/m³ | 2–3 years (reuse) |
| 2,000 m³/day | $2.5M – $8.0M | $0.28 – $0.55/m³ | $0.55 – $0.85/m³ | 2–3 years (reuse) |
OPEX typically splits 35–45% energy, 15–20% chemicals, 15–25% labor, 10–20% sludge disposal, and 5–10% membrane replacement for MBR-equipped plants. A more detailed line-item breakdown for the DAF stage — the second-largest equipment cost after MBR — is in the DAF system cost and ROI benchmark. For multi-site readers operating in Southeast Asia, the food processing wastewater treatment in Singapore guide covers tropical-temperature design adjustments that shift DAF air-saturation and MBR HRT targets by 10–20%.
Reuse economics drive the payback math. Recovered water at the RO outlet is valued at $1.50–$3.00/m³ against fresh-water tariffs in most jurisdictions, and at 75–95% RO recovery the revenue line covers the RO membrane replacement reserve and most of the chemical OPEX inside 2–4 years. Plants under 200 m³/day rarely justify the RO train on payback alone but can clear it on water-security grounds.
Frequently Asked Questions
What effluent COD can a beverage MBR reliably achieve?
A properly sized MBR running at MLSS 8,000–12,000 mg/L and HRT 8–14 hours delivers <50 mg/L COD and <1 mg/L TSS at 95–98% removal, comfortably inside EU BAT-AEL and most municipal sewer consents.
Is DAF always needed upstream of a biological stage in beverage plants?
Yes for any line with syrup, flavor dosing, or bottled-oil carryover. Without DAF, FOG coats biological floc and drops MBR flux by 40–60% inside a week, forcing chemical membrane CIP intervals from quarterly to weekly.
How is beverage wastewater different from brewery wastewater?
Brewery effluent runs higher in BOD (often 2,000–6,000 mg/L) and lower in CIP chemical loading. Soft-drink and juice streams have lower BOD (800–3,000 mg/L) but wider pH swings (2–12) and higher color loads from fruit concentrates.
Can beverage plant wastewater be reused for CIP?
Yes. RO polish at 75–95% recovery produces reuse-grade water suitable for final-rinse CIP, cooling-tower make-up, and low-pressure boiler feed, provided the upstream MBR is stable at <50 mg/L COD.
What is the typical BOD/COD ratio for soft-drink wastewater?
0.5–0.7, reflecting the dominance of readily biodegradable sugars and the absence of recalcitrant compounds; this is the headline ratio that makes beverage streams far more treatable than petrochemical or pharmaceutical effluent.