Why Canning Effluent Demands Its Own Treatment Design
A canned food effluent treatment plant in 2026 is engineered around two defining constraints that distinguish it from generic food ETP templates: a 4–10× seasonal peak-to-average flow ratio and a high-salinity, high-COD, starch/syrup/brine-loaded wastewater (typically 1,500–6,000 mg/L COD, 20–60 mg/L oil & grease, 1–4% NaCl). A defensible design combines screening, grit removal, DAF for FOG and suspended solids, equalization, biological treatment (MBR or SBR), and tertiary RO polishing for ≥70% water reuse.
Three effluent streams drive the load ledger. First, product washing and peeling water carries 500–1,500 mg/L COD plus suspended peel and pit debris. Second, blanching syrup and starch carryover generates 3,000–8,000 mg/L COD with a favorable BOD/COD ratio. Third, brining operations on legumes, olives, and pickles discharge 1–4% NaCl with low BOD but high conductivity that will poison a non-acclimated biomass. A fourth stream — alkaline CIP (cleaning-in-place) blowdown at pH 10–12 — arrives in slugs and resets the equalization tank's pH correction budget every shift.
The seasonal peak is the single most undersized unit in canning ETP failures. A fruit campaign running August through October can push daily flow 4–10× above the winter low. Equalization volume, not biological capacity, is what fails first. In 2026, the regulatory frame for canned food ETP design rests on China GB 21901-2008 for new construction discharges, US EPA 40 CFR Part 405 fruit & vegetable subcategory for BOD/TSS limits, and EU Implementing Decision 2018/229 establishing BAT-AEL for food processing. Any design that treats canning as a sub-case of "food ETP" without addressing peaks and salinity will fail compliance review or operate at <40% of design load during the off-season.
Canned Food Effluent Characteristics by Sub-Process
Canning effluent characteristics vary sharply by sub-process, and the loading math must be built per stream before the equalization tank is sized. The table below summarizes the four canonical streams an engineer will encounter in a 50–500 m³/day fruit, vegetable, or brine line.
| Sub-process stream | COD (mg/L) | BOD/COD ratio | TSS (mg/L) | Salinity / pH | Design implication |
|---|---|---|---|---|---|
| Fruit/vegetable wash & peel | 500–1,500 | 0.5–0.7 | 300–800 | Near neutral | Screening + grit; biodegradable |
| Blanching syrup / starch | 3,000–8,000 | 0.6–0.7 | 200–600 | Near neutral, hot (50–60°C) | Heat recovery; high BOD shock |
| Brine discharge (olives/legumes) | 500–2,000 | 0.3–0.5 | 100–400 | 1–4% NaCl, pH 4–6 | RO pre-treatment; biomass acclimation |
| CIP blowdown | 200–1,000 | <0.3 | 50–200 | pH 10–12, high alkalinity | Equalization + pH correction with CO₂/lime |
Worked example for the loading ledger: a fruit cannery processing 50 t/day of finished product typically generates 8–15 m³ effluent per ton of product across the wash/blanching loop, yielding 400–1,500 kg COD/day in the front-end streams. Add the blanching condensate (carrying 30–60% of the total COD load at 50–60°C) and a single campaign week can push a 200 m³/day design to 600 m³/day in real flow.
Canonical secondary parameters: TKN 30–150 mg/L (ammonia from protein-bearing lines like peas, beans, meats), total phosphorus 10–40 mg/L, sulfate from SO₂ blanching can exceed 500 mg/L and produce H₂S in the equalization tank if not stripped. Shock loadings to flag in the design basis: lye-peeling spikes push pH above 12, color bodies from berry and cherry pitting are recalcitrant to conventional activated sludge (treat with Fenton or ozone polishing if reuse is targeted), and seasonal product changeovers drive pH swings of 2–3 units within hours — equalization tank sizing must absorb these transients before they reach the biology.
Reference Process Flow for a Canned Food ETP
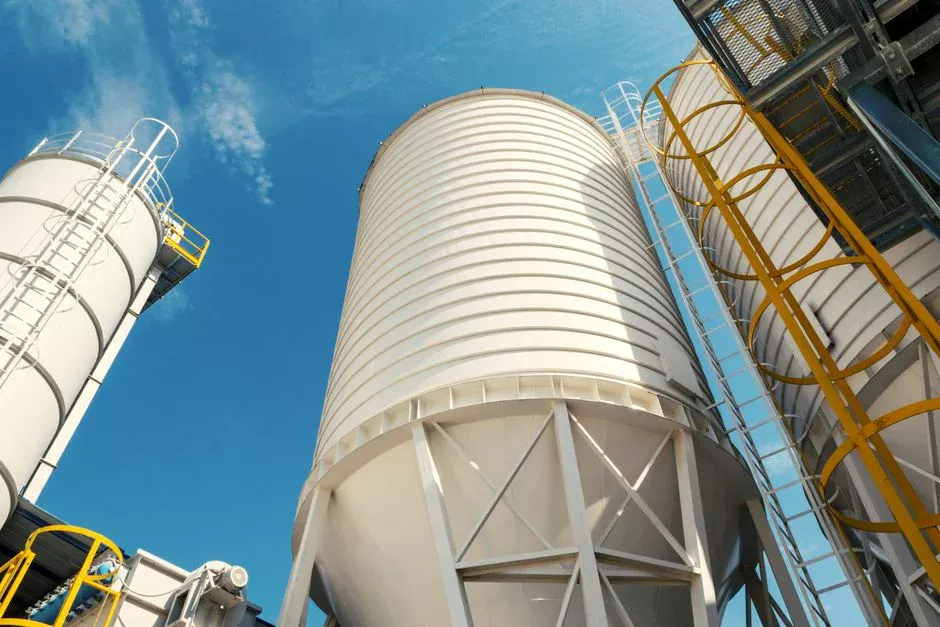
The reference flow below is the unit sequence an engineer can defend in a design review for a 50–500 m³/day cannery. Each step addresses a specific failure mode documented in canning ETP retrofits.
- Headworks: Coarse bar screen (10–25 mm clearance) followed by a rotary mechanical bar screen for headworks with 1–3 mm perforations to strip fruit peel, pit fragments, and label debris before they blind the grit chamber.
- Grit removal & DAF: Parabolic grit chamber, then an industrial DAF system for food processing wastewater as the workhorse primary clarifier. DAF targets 90–95% FOG removal and 60–80% TSS stripping on the syrup/starch carryover stream — a settling tank cannot match this on buoyant fruit and vegetable solids.
- Equalization: A mechanically mixed EQ tank sized to 8–24 hours of peak flow with pH correction (lime for acid spikes, CO₂ for alkaline CIP blowdown). EQ is the single most under-built unit in canned food ETP failures — see the sizing calculation in the section below.
- Biological treatment: MBR for plants >500 m³/day, footprint-constrained sites, or any facility targeting reuse; SBR for canneries <500 m³/day with sharp seasonal peaks and sufficient land.
- Tertiary polishing & reuse: Sand/anthracite multimedia filter plus RO for closed-loop reuse at 60–80% recovery when freshwater cost or discharge charges justify the CAPEX. For non-reuse discharge, add a disinfection stage.
- Sludge handling: DAF float and biological WAS thickened on the DAF, then dewatered with a plate-and-frame filter press for ETP sludge to 22–28% DS cake. Belt presses are generally unsuitable for the oily, fibrous sludge profile from canning lines.
The pre-treatment, equalization, and sludge units are the same regardless of which biological reactor is selected downstream; the MBR/SBR decision is treated in the next section.
Biological Treatment: MBR, SBR, or Conventional Activated Sludge?
Selecting the biological reactor is the most consequential decision in a canned food ETP design because canning effluents trigger filamentous bulking on conventional activated sludge and produce high suspended solids on SBR decant. The decision table below maps the three options against the canner's flow profile, footprint, and reuse target.
| Reactor type | Best-fit cannery profile | Effluent quality | Footprint | CAPEX index | Key design risk |
|---|---|---|---|---|---|
| MBR (PVDF submerged, 0.1–0.4 μm) | >500 m³/day, reuse target, footprint-constrained | <50 mg/L COD, <5 mg/L BOD, <1 NTU | Compact (50% of CAS) | 1.4–1.8× | Membrane fouling on high-carbohydrate load |
| SBR | <500 m³/day, sharp seasonal peaks, sufficient land | <80 mg/L COD, <20 mg/L BOD | 1.2–1.5× MBR | 1.0× | Decant clarity during high TSS spikes |
| Extended-aeration activated sludge | Lowest CAPEX priority, low seasonal swing | <120 mg/L COD, <30 mg/L BOD | 2–3× MBR | 0.7–0.9× | Filamentous bulking on syrup/starch |
For canneries targeting reuse, the integrated MBR membrane bioreactor for cannery reuse delivers the lowest turbidity and most stable effluent for RO feed. If the design routes through MBR, specify an anti-fouling protocol: 30-minute backflush every 8–12 hours, and chemical cleaning with 500–1,000 mg/L NaOCl every 2–4 weeks. SRT must be held at 20–30 days — substantially longer than the 5–10 days typical of municipal activated sludge — to suppress filamentous growth on the high-carbohydrate load. Reference the MBR membrane bioreactor module specification when sizing membrane area against the peak-day flux.
Sizing the DAF and Equalization Tank: Quick Calculation
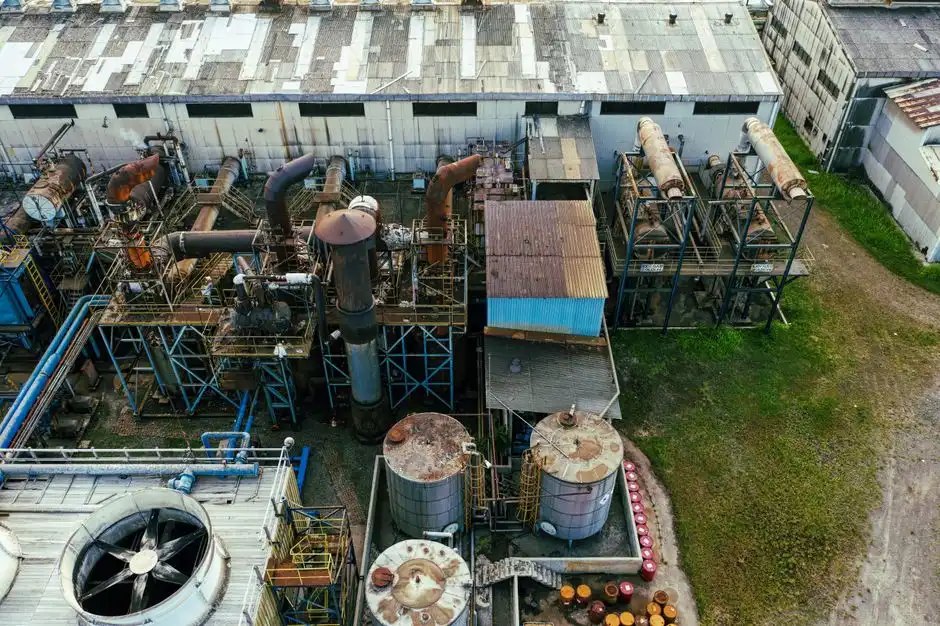
These two units set the cost and reliability of the entire front end. Use the parameters below as a tender-stage check before committing to vendor modeling.
DAF sizing. Hydraulic loading rate: 5–15 m³/m²·h surface overflow, with flotation time of 20–30 minutes. Air-to-solids ratio (A/S) of 0.02–0.05 is typical for food FOG; below 0.02 the float is thin and oily, above 0.05 the recycle pump dominates power draw. Chemical dose: 5–15 mg/L polyaluminium chloride (PAC) coagulant, followed by 0.5–2 mg/L anionic polyacrylamide (A-PAM) flocculant — the floc must hold together under the recycle shear in the contact zone, so dose rates should be jar-tested per stream. Reference the industrial DAF system for food processing wastewater spec for matching surface area to peak flow.
Equalization tank sizing. Use the formula V_eq = Q_peak × t_peak − Q_avg × t_peak, with 8–24 hours of peak flow storage, then apply a 1.5× safety factor for seasonal campaigns beyond the design day. Example: a 200 m³/day average cannery with a 6× peak ratio (1,200 m³/day on campaign days) needs V_eq = (1,200 − 200) × 1.0 day × 1.5 = 1,500 m³ — and that is before adding 20% for the alkalinity swing from CIP blowdown. EQ volume is the parameter most often under-stated in canned food ETP tenders.
Aeration tank SRT. Hold 20–30 days SRT to suppress filamentous bulking on the carbohydrate load; this is roughly 3× the municipal design value. Pair the aeration basin with an automatic coagulant and pH dosing system to keep the EQ-to-biology transition within ±0.5 pH units during a lye-peeling spike. For a complementary unit-operation deep dive, see the beverage wastewater aeration system design guide — many of the same aeration principles apply, with a few canning-specific caveats on foam control.
Reuse, Zero Discharge, and Sludge Handling
Closing the loop turns wastewater from a cost line into a freshwater offset. MBR + RO polishing achieves 60–80% reuse for non-contact applications: boiler feed, cooling tower makeup, and CIP pre-rinse water (the last requires RO permeate quality, not just MBR). When freshwater tariffs exceed ~$1.5/m³ or discharge charges exceed ~$0.5/m³, the RO CAPEX pays back inside five years for a 1,000 m³/day plant.
Zero liquid discharge (ZLD) is justified when the canner is inland, water-scarce, or already on a municipal supply tariff above $2.5/m³. The ZLD train adds an evaporator and crystallizer downstream of RO; brine volumes from a 1,000 m³/day cannery are typically 50–100 m³/day at 8–12% TDS, which a mechanical vapor recompression (MVR) evaporator can concentrate to <2% of feed. Compare to a similar ZLD scope in the food processing wastewater treatment in Morocco guide for a Mediterranean parallel.
Sludge handling runs DAF float + WAS through the same DAF as a thickener, then to a plate-and-frame filter press for ETP sludge targeting 22–28% DS cake. Below 22% DS, transport cost dominates OPEX; above 28% DS, the press cycle time stretches past economic limits. For non-contact reuse disinfection in the reuse loop, pair RO permeate with a chlorine dioxide generator sized for 0.5–1.0 mg/L residual. Heat integration is a parallel opportunity: the blancher condensate at 50–60°C is the largest single energy-recovery stream, and routing it through a plate heat exchanger to pre-warm the CIP rinse water can recover 8–15% of plant thermal load — see the snack food wastewater treatment equipment guide for a worked example.
CAPEX and OPEX Benchmarks for a Canned Food ETP
Use the table below to anchor vendor quotes during tender evaluation. All figures are 2026 industry ranges for a 100–500 m³/day canning ETP; actual site conditions, soil, and electrical tariffs will move numbers by ±25%.
| Cost line | Range | Basis / note |
|---|---|---|
| CAPEX (turnkey, civil +机电 + commissioning) | $250–900 per m³/day of design capacity | Excludes land; MBR trains at the upper end, SBR at the lower end |
| OPEX (total treated effluent) | $0.35–1.10 per m³ | Includes electricity, chemicals, sludge disposal, labor |
| — Electricity share | ~45% of OPEX | Blowers, recycle pumps, RO high-pressure pump |
| — Chemical dosing share | ~25% of OPEX | PAC, A-PAM, NaOCl, CIP neutralization |
| — Sludge disposal share | ~20% of OPEX | 22–28% DS cake haul-off or composting |
| — Labor share | ~10% of OPEX | 1–2 operators per shift for a 300 m³/day plant |
| Reuse payback (RO at 70% offset) | 3–5 years | At freshwater cost $1.5–3.0/m³, 1,000 m³/day plant |
Sludge is the most under-modeled cost line. The 22–28% DS target is the breakeven window — drop to 18% DS and the haul-off tonnage roughly doubles. The filter press operating cost in 2026 analysis gives the per-cycle kWh and polymer drawdown that drive the OPEX line above.
Frequently Asked Questions
What is the typical COD range for canned food effluent?
Canned food effluent typically runs 1,500–6,000 mg/L COD as a composite, with blanching syrup streams reaching 8,000 mg/L and brine discharges dropping to 500–2,000 mg/L. BOD/COD ratio sits at 0.5–0.7, which is favorable for biological treatment without nutrient supplementation.
How much equalization volume does a cannery ETP need?
Size for 8–24 hours of peak flow with a 1.5× safety factor for seasonal campaigns. A 200 m³/day average cannery with a 6× peak ratio typically requires 1,200–1,500 m³ of equalization volume — the single most undersized unit in canning ETP retrofits.
MBR or SBR for a 300 m³/day cannery?
SBR fits a 300 m³/day cannery with adequate land and no reuse target. MBR fits the same flow if reuse is targeted, land is constrained, or the effluent must drop below 50 mg/L COD for RO feed. MBR CAPEX runs 1.4–1.8× SBR, but eliminates the secondary clarifier and sludge recycle issues.
Can a cannery achieve zero liquid discharge?
Yes, with an MBR + RO + evaporator/crystallizer train. For a 1,000 m³/day plant, brine volume is 50–100 m³/day at 8–12% TDS, and a mechanical vapor recompression evaporator can concentrate to <2% of feed. ZLD is economic when freshwater tariffs exceed $2.5/m³.
What is the peak-to-average flow ratio for a seasonal cannery?
A typical cannery runs 4–10× peak-to-average flow during a fruit or vegetable campaign. This is 5–20× the diurnal swing of municipal wastewater and is the defining hydraulic constraint of any canned food ETP design.