Circular Water Economy Industrial Reuse: The 2026 Outlook in One Number
The circular water economy industrial reuse 2026 outlook is a 9.1% CAGR, with global water-reuse spending surpassing $1.4 trillion by 2030. Regulatory pull, basin scarcity, OPEX parity, and ESG disclosure now redirect roughly 1-in-11 incremental water CAPEX dollars toward reuse equipment.
The circular water economy is the closed-loop segment of the water market where industrial and municipal effluent is treated for direct reuse, reclaim, or resource recovery. It is the only segment of the broader water utility market that drives equipment CAPEX. The consensus forecast for this segment sits at 9.1% CAGR through 2026, with the global water-reuse market projected to surpass $1.4 trillion by 2030 (industry analyst consensus per MarketsandMarkets and Global Water Intelligence framing, 2025). That figure does not include behavioral water conservation, agricultural irrigation efficiency, or stormwater capture — it counts only the engineered treatment, pumping, and reuse infrastructure that physically moves water back into a process.
According to the US EPA, water reuse means reclaiming water from a variety of sources, treating it, and reusing it for beneficial purposes. 2026 is the inflection year because three separate clocks converge. The EU Industrial Emissions Directive (IED) 2010/75/EU BAT-AEL revisions entered their implementation phase in 2025. China's 14th Five-Year Plan extension targets raise industrial reuse rates above 50% in coal-chemical and textile zones, and reuse unit costs have crossed parity with freshwater-plus-discharge at most stressed-basin sites.
By 2026, the median reverse-osmosis-plus-pretreated-freshwater cost curve in China, India, and the U.S. Southwest sits at or below $0.50/m³ LCOW (HydropureWater engineering references, 2025), against blended freshwater-and-discharge tariffs of $0.80-2.20/m³ in the same regions. A plant manager reading the 9.1% headline should translate it as follows: roughly 1-in-11 dollars of incremental 2026 water CAPEX is being redirected from greenfield freshwater supply toward reuse infrastructure.
The Four Demand Drivers Pushing the 2026 Growth Rate
Regulatory pull is the strongest single driver in 2026, and it is a hard number rather than a sentiment. The EU IED 2010/75/EU revised BAT-AELs for waste water treatment, including tightened COD (≤30 mg/L for direct discharge to sensitive recipients) and TOC limits applied to all IED-permitted installations since 2025-08. According to the European Commission, the IED now covers over 50,000 industrial installations, so each BAT-AEL revision propagates through tens of thousands of permits.
The Urban Waste Water Treatment Directive 91/271/EEC was recast in 2024 with explicit reuse targets for agglomerations above 100,000 p.e. China's GB 8978-1996 remains the baseline standard but the 14th FYP extension overlay adds reuse quotas of 50-65% in coal-chemical, textile, and steel clusters. In the U.S., the EPA Effluent Guidelines Program continues tightening metal-finishing, steam-electric, and oil-and-gas categories. When four major jurisdictions all tighten simultaneously, equipment demand follows in a 12-24 month window — that is what 2026 looks like in order books.
Water scarcity is the physical forcing function. The World Resources Institute Aqueduct dataset classifies the Colorado, Yellow, Tigris-Euphrates, Indus, and Murray-Darling basins as high-to-extremely high stress (WRI Aqueduct 4.0, 2025). In these basins, industrial water use competes directly with municipal supply, so reuse is no longer optional — it is a permitting requirement for new capacity.
The third driver is OPEX arithmetic: reuse offsets freshwater intake ($0.15-0.60/m³), wastewater discharge ($0.10-0.40/m³), and concentrate disposal ($0.05-0.20/m³) for a combined avoided cost of $0.30-1.20/m³ depending on tariff structure. The fourth driver — ESG and supply-chain disclosure — converts the engineering decision into a board-level one. CSRD-mandated water metrics, CDP Water Security questionnaire scoring, and semiconductor and apparel brand supply-chain requirements (e.g., ZDHC, RBA) now include reuse-rate KPIs that procurement teams must report.
| Driver | 2026 Mechanism | Hard Trigger | Site-Level Impact |
|---|---|---|---|
| Regulatory pull | IED BAT-AEL enforcement, GB 8978-1996 + 14th FYP overlay | Permit renewal | Forced upgrade or shutdown |
| Water scarcity | WRI Aqueduct 4.0 high-stress basin listing | New capacity allocation | Reuse is a permitting condition |
| OPEX arithmetic | Tariff escalation, concentrate disposal cost | Annual budget cycle | 2.5-4 year payback thresholds |
| ESG / supply chain | CSRD, CDP Water, ZDHC | Customer audit | Board-level KPI gating |
Market Sizing by Region: Where the 2026 Growth Is Concentrated

Asia-Pacific holds the largest 2026 deployment volume, with China alone accounting for an estimated 38-42% of global industrial reuse CAPEX (industry analyst consensus, 2025). Chinese demand is driven by ZLD mandates in coal-chemical clusters (Inner Mongolia, Shaanxi, Ningxia), textile zones (Zhejiang, Jiangsu, Guangdong), and electronics manufacturing (Shanghai, Shenzhen, Hubei). India is the second-largest Asia-Pacific contributor, concentrated in textile dyeing (Tirupur, Surat), pharmaceutical APIs, and refining. Both countries benefit from capex subsidy programs and provincial-level reuse quotas attached to industrial park approvals.
Middle East and North Africa posts the highest growth rate at 12-14% CAGR through 2026. It is anchored by Saudi Vision 2030 reuse targets — full reuse of treated municipal wastewater by 2030 — and GCC national water strategies mandating industrial reuse rates of 60-90% in oil-and-gas, petrochemical, and power generation. Europe is retrofit-led rather than greenfield-led: IED compliance, CSRD reporting, and the 2024 recast of the Urban Waste Water Treatment Directive create sustained equipment demand, but at lower volume and higher unit value per site. North America is shale-and-semiconductor-led — produced-water reuse in the Permian Basin and fab-grade reuse in Arizona, Texas, and Ohio are the two largest 2026 CAPEX subsegments.
The region-by-region policy detail sits in the Circular Water Economy Regional Analysis 2026: Market, Policy & Tech by Region companion, which maps quotas and subsidy windows to each cluster named above. Procurement teams using it should weigh volume share against growth rate: China buys the most equipment, MENA compounds fastest.
| Region | 2026 Volume Share | CAGR (2025-2030) | Dominant Driver |
|---|---|---|---|
| Asia-Pacific (China, India) | 38-42% | 9-10% | ZLD mandates, industrial park reuse quotas |
| Middle East & North Africa | 8-10% | 12-14% | Vision 2030, GCC national water strategies |
| Europe | 18-22% | 6-8% | IED compliance, UWWTD recast, CSRD reporting |
| North America | 15-18% | 8-10% | Shale produced water, semiconductor fab construction |
| Rest of World | 10-12% | 7-9% | Latin America mining, ASEAN refining |
Technology Breakdown: Which Equipment Segments Capture the Growth
The 9.1% headline growth does not land uniformly across process technologies. Membrane bioreactors (MBR) form the workhorse pretreatment for most reuse trains, with a market trajectory from $4.1B in 2025 to roughly $6.8B by 2030 at 8.9% CAGR (industry analyst estimates, 2025). Industrial reverse osmosis follows a similar trajectory with 8-9% CAGR, anchored by recovery rates up to 95% under continuous PLC operation and energy consumption of 0.4-0.7 kWh/m³ permeate at modern plant design.
ZLD hybrid configurations — typically RO followed by mechanical vapor recompression evaporators or forward-osmosis concentration — are the fastest-growing subsegment at 12-15% CAGR, with documented 99.8% recovery demonstrated in gallium-nitride fab wastewater streams (HydropureWater reference projects, 2025-2026). The pretreatment stack — DAF, lamella, and multi-media filtration — grows broadly in line with reuse because every reuse train begins with TSS, FOG, and hardness reduction.
A reader evaluating a 2026 project should map influent to the technology layer that handles the constraint. High organics and variable flow point to an MBR membrane bioreactor system as the biological workhorse; high salinity and strict permeate quality point to an industrial RO system with up to 95% recovery.
High oil, grease, or suspended solids upfront points to a DAF pretreatment system, while heavy settleable mineral load favors the High-Efficiency Sedimentation Tank (Lamella Clarifier) ahead of the membranes. That split mirrors how real trains are built: flotation for FOG, lamella for silt and hardness carryover, then biology, then RO.
For further technology forecasting, the MBR market growth 2026 outlook article walks through the segment shifts in more detail.
| Technology | 2025 Market Size | CAGR | 2030 Projection | Typical Use Case |
|---|---|---|---|---|
| MBR | $4.1B | 8.9% | $6.8B | Municipal-grade reuse, pre-RO polishing |
| Industrial RO | $6.5B | 8-9% | $10.0B | Pharma, semiconductor, F&B, power |
| ZLD hybrid (RO + EVR/FO) | $1.8B | 12-15% | $3.5B | Coal-chem, GaN fabs, refining |
| DAF / lamella pretreatment | $2.0B | 7-8% | $2.9B | F&B, textiles, oil & gas |
Industrial Verticals: Who Is Actually Buying in 2026
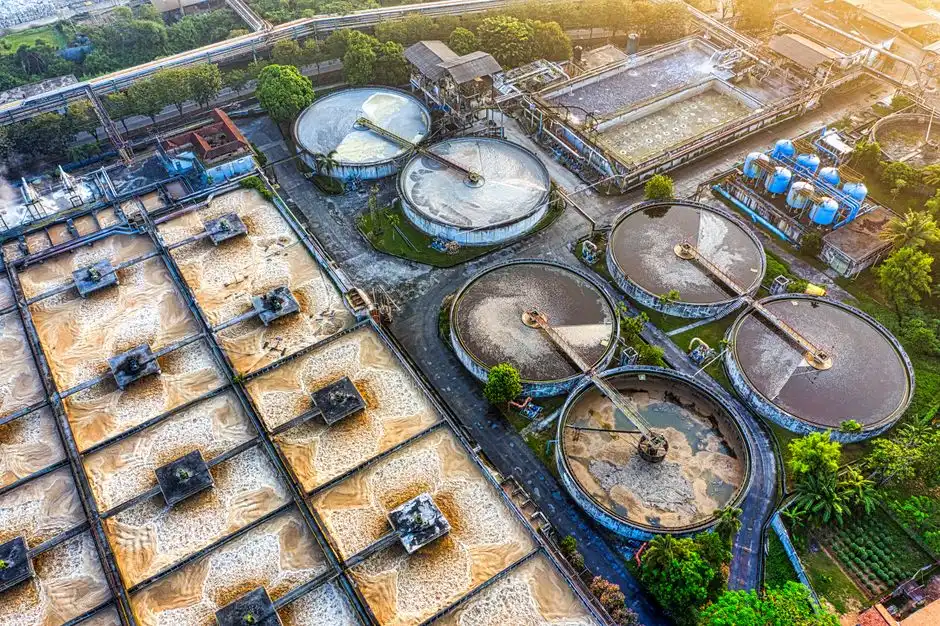
Petrochemicals and refining are the largest absolute CAPEX contributors in 2026, primarily for produced-water reuse and desalter-effluent ZLD. Refinery-integrated ZLD plants sized for 5,000-20,000 m³/day are the most common project type, and many include resource recovery (sodium sulfate, sodium chloride) as a co-product credit. Semiconductors and electronics carry the highest water-quality bar — ultrapure reuse loops combine RO with electrodeionization (EDI) and mixed-bed polishing, and fab shutdowns tied to reuse water quality are the single largest financial risk in 300mm wafer fabs.
Food and beverage is DAF-led at the front end and MBR-led for the biological step, with dairy and beverage bottling as the two largest subsegments. Textiles and dyeing are driven by India and Bangladesh, where RO reuse recovers salt (a marketable byproduct) and reduces freshwater intake simultaneously.
For a full buyer-side landscape across these segments, the top water reuse equipment manufacturers in 2026 comparison provides project-level reference data. Compliance-driven buyers in chemicals and refining will also want the 2026 global chemical wastewater compliance guide, which maps IED and GB 8978-1996 thresholds to specific treatment train configurations.
The integrated water purification system and automatic chemical dosing system are the equipment anchors that connect the regulatory thresholds to deployed process trains in chemical and F&B projects.
What 9.1% CAGR Means for Your 2026 CAPEX Decision
The 9.1% headline is a macro signal, not a project decision. The site-level decision rule is narrower. If your facility sits in a WRI-classified high-stress basin or discharges to a regulator enforcing IED BAT-AEL or GB 8978-1996, the cost-parity crossover for reuse versus freshwater-plus-discharge has already occurred in 2025-2026. The decision should be framed as a 5-year TCO comparison, not a CAPEX comparison — reuse equipment at current tariff structures pays back in 2.5-4 years when freshwater, discharge, and concentrate disposal costs are aggregated.
Two practical risks deserve explicit hedging in the design phase. Concentrate disposal cost creep — rising landfill and deep-well injection fees — can erode the OPEX case by 15-25% over the project life, and a 30% electricity price swing in either direction shifts payback by 6-12 months. For sludge-handling trains attached to reuse projects, the filter press for sludge dewatering and rotary mechanical bar screen are the upstream/downstream anchors that determine the dewatered-cake disposal cost line.
For OPEX modeling on the membrane and ZLD side, the forward osmosis OPEX in 2026 breakdown gives a defensible baseline for membrane replacement, cleaning chemical consumption, and energy use per cubic meter of permeate.
Next Steps for Plant Teams Planning 2026 Reuse
That is the practical core of the circular water economy industrial reuse 2026 outlook: growth follows permits and tariffs, and both are moving in one direction. The wider vendor-side picture is in the Circular Water Economy 2026 Outlook: Tech, Policy & B2B Equipment review, and teams who need a running feed of "water treatment" circular economy news 2026 can follow the key-players page covering vendors, utilities, and regulators.
When a specific site is on the table, compress the decision to three inputs: influent characterization, discharge permit or reuse target, and the local tariff sheet. Send those through the reuse project sizing inquiry and the train — pretreatment, biology, membranes, dewatering — gets sized against the payback math above.
Frequently Asked Questions
What is the 2026 growth rate of the circular water economy?
The consensus forecast is 9.1% CAGR through 2026. That growth rate belongs to the engineered reuse segment — treatment, pumping, and reuse infrastructure — and comes with a global water-reuse market projected to surpass $1.4 trillion by 2030 (industry analyst consensus, 2025). Behavioral conservation and irrigation efficiency sit outside the count.
Which region has the highest circular water growth in 2026?
Middle East and North Africa leads on growth rate, at 12-14% CAGR. Saudi Vision 2030 targets full reuse of treated municipal wastewater by 2030, while GCC national water strategies require 60-90% industrial reuse rates in oil-and-gas, petrochemical, and power generation. Asia-Pacific still holds the largest deployment volume by share.
What is the fastest-growing equipment segment?
ZLD hybrid systems — RO plus evaporator or forward osmosis — are the fastest-growing segment, expanding at 12-15% CAGR. Documented recovery reaches 99.8% in gallium-nitride fab wastewater streams. Coal-chemical clusters and semiconductor fabs are the two demand poles anchoring that growth.
How long does industrial reuse equipment take to pay back?
2.5-4 years at current freshwater and discharge tariff structures. The figure assumes a 5-year TCO comparison rather than a CAPEX-only comparison, with freshwater intake, wastewater discharge, and concentrate disposal savings aggregated. A 30% electricity price swing shifts payback by 6-12 months in either direction.
What is the typical recovery rate of an industrial RO system?
Up to 95% recovery under continuous PLC operation. Energy consumption runs 0.4-0.7 kWh/m³ permeate at modern plant design, which is the number that anchors reuse OPEX models. Recovery above that band usually requires ZLD hardware — evaporators or forward-osmosis concentration — rather than RO alone.