Why 2026 Is the Inflection Year for Industrial Water Reuse
The circular water economy — defined as a closed-loop model where industrial effluent is treated to fit-for-purpose quality and reused, with co-recovered resources such as biogas, nutrients, and heat feeding back into production — is moving from pilot deployments to utility-scale capex in 2026. The resource recovery from wastewater market is projected to reach $591B by 2030 at roughly 11% CAGR (HydropureWater research database, 2026), and 2026 is the year industrial procurement shifts from feasibility studies to multi-million-liter-per-day installations. Three forces are converging simultaneously: EU Water Reuse Regulation 2020/741 enforcement deadlines, China's 14th Five-Year Plan water recycling quotas, and corporate net-zero mandates from CDP and SBTN that now require quantified water stewardship disclosures. Industrial water costs $2–$10/m³ in water-stressed basins across North America, southern Europe, and the Middle East, and reuse at 90% recovery cuts freshwater intake by an order of magnitude while reducing per-cubic-meter discharge fees. The combination of regulatory deadlines, ESG pressure, and proven unit operations makes 2026–2027 the compliance window plant managers must align capex with — a point reinforced in our circular water economy regional analysis for 2026.
2026 Policy & Regulatory Landscape: EU, China, and the US
EU Water Reuse Regulation 2020/741 became fully applicable on 26 June 2023, and 2026 marks the first full year of binding member-state enforcement for industrial and agricultural reclaimed water. The regulation defines four risk classes (A through D) with minimum reclaimed water quality thresholds for E. coli (≤10 CFU/100 mL for Class A), BOD5 (≤10 mg/L for Class A), TSS (≤10 mg/L for Class A), and turbidity (≤5 NTU for Class A), with progressively relaxed limits through Class D for lower-exposure end uses. China is operating under the 14th Five-Year Plan, which targets an industrial water recycling rate above 70% in water-stressed provinces including Hebei, Shandong, and Inner Mongolia; the GB/T 19923-2024 reuse standard (urban recycled water) provides a parallel reference that domestic facilities in textile, chemical, and power generation can voluntarily adopt. In the US, the EPA 2024 Effluent Limitations Guidelines (ELG) revisions tightened PFAS, total nitrogen, and phosphorus discharge limits across steam electric and metal-finishing point sources, accelerating adoption of high-recovery RO and zero-liquid-discharge (ZLD) configurations. Saudi Arabia, the UAE, and Egypt are running parallel industrial reuse mandates at 40–70% depending on sector and region. The 2026–2027 compliance deadline cluster is the most concentrated in two decades, and a regional view of the capex pipelines is available in our circular water economy regional analysis for 2026.
| Region | Key Instrument | 2026 Status | Industrial Threshold |
|---|---|---|---|
| EU | Regulation 2020/741 | Enforcement year 1 | Class A: BOD5 ≤10 mg/L, turbidity ≤5 NTU |
| China | 14th FYP + GB/T 19923-2024 | Recycling target >70% (stressed provinces) | COD ≤30 mg/L, NH3-N ≤5 mg/L (Class A reuse) |
| US | EPA 2024 ELG revisions | Permit renewals 2025–2026 | Tightened PFAS, N, P limits by sector |
| MENA | National reuse mandates | 40–70% reuse by sector | Industrial specific per license |
The Circular Water Treatment Train: DAF → MBR → RO
The canonical high-reuse treatment train for industrial facilities stacks three unit operations: dissolved air flotation (DAF) for pre-treatment, a membrane bioreactor (MBR) for biological oxidation and solids separation, and reverse osmosis (RO) for dissolved salt polishing. A well-engineered dissolved air flotation (DAF) pre-treatment system removes 80–95% of TSS and 90%+ of FOG, protecting downstream membranes from organic fouling; the DAF line covers 4–300 m³/h across 13 skid sizes. The MBR stage combines activated sludge with submerged PVDF ultrafiltration at a 0.1 μm pore size, producing effluent with TSS <1 mg/L, COD <50 mg/L, and turbidity <1 NTU — water suitable for direct RO feed without media filtration, which removes 2–3 conventional unit operations from the train. RO polishing then achieves 95–99% dissolved salt rejection and 70–90% recovery per pass; with two-pass and energy recovery device configurations, an industrial reverse osmosis system can deliver overall recoveries up to 95%. Ancillary stages include chemical dosing (coagulant, antiscalant, pH adjustment) and disinfection, with ClO₂ generators from 50 g/h to 20,000 g/h covering the full range from small facilities to large industrial plants. Energy intensity for the full train sits at 1.0–2.5 kWh/m³, compared to 2.5–4.0 kWh/m³ for conventional activated sludge plus tertiary treatment — the engineering basis for this comparison is detailed in our MBR vs conventional activated sludge comparison.
| Stage | Function | Key Spec | Energy Intensity |
|---|---|---|---|
| DAF | TSS, FOG, colloid removal | 80–95% TSS, 90%+ FOG; 10–20 m³/m²/h | 0.05–0.10 kWh/m³ |
| MBR | BOD/COD oxidation + ultrafiltration | TSS <1 mg/L, COD <50 mg/L, 0.1 μm pore | 0.3–0.6 kWh/m³ |
| RO | Dissolved salt removal | 95–99% rejection, 70–95% recovery | 0.5–1.5 kWh/m³ (with ERD) |
| Disinfection | Pathogen control | ClO₂ 0.5–2 mg/L residual or UV 30–40 mJ/cm² | 0.02–0.05 kWh/m³ |
Technology Comparison: Which Reuse Configuration Fits Your Facility?
Selecting the right treatment configuration depends on three variables: influent strength, end-use water quality target, and whether brine discharge is feasible. Facilities discharging to a permitted surface-water body with no reuse intent typically require only Package A — DAF plus biological (SBR or AAO) — at low capex and no membrane investment. Package B — DAF + MBR — is the workhorse for in-process reuse: cooling tower make-up, boiler feed pre-treatment, and landscape irrigation; the MBR membrane bioreactor system using MBR flat sheet membrane modules (DF series 80–225 m², producing 32–135 m³/day per cassette) delivers a footprint roughly 60% smaller than conventional activated sludge. Package C — DAF + MBR + RO — is required for high-purity reuse such as boiler feed, pharmaceutical process water, or ZLD pre-treatment, with 90–95% overall water recovery and a step-up in both capex and energy. Package D adds a brine crystallizer downstream of RO for full ZLD in water-stressed contexts: mining, coal-to-chemicals, and thermal power plants. The decision rule that surfaces most often in our 2026 enquiry set: when freshwater cost exceeds $3/m³ and discharge volume exceeds 500 m³/day, Package C payback typically falls in the 3–5 year range.
| Package | Train | Best-Fit End Use | Recovery | Capex Range ($/m³/day) |
|---|---|---|---|---|
| A | DAF + SBR/AAO | Discharge compliance only | N/A | $150–$400 |
| B | DAF + MBR | Cooling tower, irrigation, UF feed | 0% liquid (water recycled as is) | $400–$900 |
| C | DAF + MBR + RO | Boiler feed, process water | 70–95% | $900–$2,000 |
| D | DAF + MBR + RO + crystallizer | ZLD, mining, power | >99% (liquid) | $2,500–$6,000 |
Resource Recovery: Turning Wastewater From Cost Center to Revenue Stream
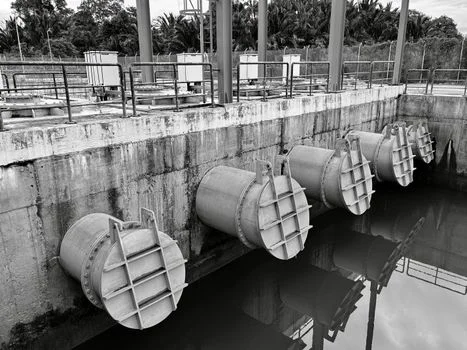
Resource recovery is the half of the circular water economy that procurement engineers most often under-specify, and 2026 is the year it becomes a board-level discussion. Anaerobic digestion of waste activated sludge produces biogas at typical yields of 0.3–0.5 m³ CH₄ per kg COD removed; with combined heat and power (CHP) the digester can offset 30–60% of plant energy use, and the biogas-from-wastewater segment is growing at 6–9% CAGR through 2030 (HydropureWater research database, 2026). Nutrient recovery via struvite (magnesium ammonium phosphate) precipitation from centrate or digestate produces a sellable slow-release fertilizer at $200–$500/tonne, with the global market growing at 7.1% CAGR to $8.4B by 2030 (HydropureWater research database, 2026). Gypsum recovered from flue-gas desulfurization wet scrubbers is reusable as construction-grade material at $5–$15/tonne, and an FGD scrubber for gypsum recovery simultaneously closes a flue-gas and water loop. Heat recovery from effluent streams via heat exchanger networks can reclaim 50–70% of thermal energy for building heating or boiler feed pre-heating, with the segment also at 6–9% CAGR through 2030 (HydropureWater research database, 2026). A well-designed circular water facility can offset 20–40% of total treatment OPEX through these streams, and the resource recovery from wastewater market forecast to 2030 is the place to start the engineering economics.
2026 B2B Procurement Checklist: Specifying Circular Water Equipment
Translating the engineering and regulatory case into a procurement document requires six concrete steps. First, require 7-day composite influent sampling for COD, BOD₅, TSS, FOG, pH, temperature, and conductivity before any equipment proposal is accepted — a single grab sample is not sufficient for biological design. Second, define the reuse end-use (cooling tower, boiler feed, irrigation, process water) and match it to a specific standard: EU 2020/741 risk class, GB/T 19923-2024, or industry-specific. Third, fix the equipment spec checkpoints: DAF surface loading rate at 10–20 m³/m²/h, MBR flux at 10–25 LMH, RO recovery at 70–90% per pass, and total energy per m³ treated. Fourth, qualify suppliers on factory acceptance test data, membrane warranty terms (5+ years for PVDF), local service footprint, and reference installations in your industry. Fifth, specify PLC-controlled automation with remote monitoring and ORP/pH/DO/turbidity sensors — for cost context, our IoT sensor cost benchmarks for wastewater monitoring cover the 2026 pricing range. Sixth, request a 10-year capex + opex model that includes membrane replacement, chemical consumption, and energy; MBR systems typically run $0.15–$0.40/m³ opex, while full DAF + MBR + RO trains run $0.40–$0.90/m³ depending on energy prices and brine management. The MBR membrane bioreactor system, the MBR flat sheet membrane modules, and an automatic chemical dosing system are the typical anchor items in a 2026 procurement schedule.
| Spec Item | Target Value | Acceptance Test |
|---|---|---|
| DAF surface loading | 10–20 m³/m²/h | Performance run with site TSS |
| MBR flux | 10–25 LMH | Sustained 30-day trial |
| RO recovery | 70–90% per pass | Site water at design feed pressure |
| MBR effluent | TSS <1 mg/L, turbidity <1 NTU | Daily lab + online turbidity |
| Energy per m³ | 1.0–2.5 kWh/m³ (full train) | Power meter on each skid |
Frequently Asked Questions
What is the circular water economy?
A closed-loop model where industrial effluent is treated to fit-for-purpose quality and reused, with co-recovered resources (biogas, nutrients, gypsum, heat) feeding back into production. EU Water Reuse Regulation 2020/741 is the binding regulatory anchor, defining minimum reclaimed water quality across four risk classes.
How big is the circular water economy market in 2026?
The resource recovery from wastewater market is projected at $591B by 2030 at roughly 11% CAGR (HydropureWater research database, 2026). The industrial reuse equipment sub-segment is growing at a comparable pace, with MBR and RO skid orders leading the volume.
What treatment train achieves 90%+ water reuse?
The DAF → MBR → RO train is the canonical high-reuse configuration. MBR delivers sub-1 μm effluent (TSS <1 mg/L, turbidity <1 NTU) and RO achieves 70–95% recovery per pass, with overall system recovery of 90–95% when staged properly.
Which EU regulation governs industrial water reuse in 2026?
EU Water Reuse Regulation 2020/741 sets minimum reclaimed water quality requirements (E. coli, BOD, TSS, turbidity) across four risk classes A through D. 2026 is the first full year of member-state enforcement, and facilities in non-compliance face permit refusal and discharge penalties.
What is the typical payback period for industrial water reuse?
Payback is typically 3–5 years when freshwater cost exceeds $3/m³ and discharge volume exceeds 500 m³/day. Adding resource recovery revenue (biogas, struvite, gypsum, heat) can shorten payback by a further 6–18 months on full-life-cycle modeling.