Why Resource Recovery Is the Defining Wastewater Story of 2025–2030
The global water and wastewater treatment market is projected to grow from $321 billion in 2024 to $591.2 billion by 2030 at an 11.0% CAGR, with resource recovery from wastewater driving the second wave of growth (BCC Research, 2025). As the share of treated wastewater rises from 20% (baseline) to 55% in 2024 and is projected to reach 80% by 2030, the recoverable-resource volume scales in parallel — every additional m³ treated is a potential feedstock for water reuse, nutrient recovery, or energy export.
For an industrial buyer, this reframes a 2020 "treat-to-discharge" line item as a 2030 "treat-to-recover" revenue stream. Recoverable resources fall into five buckets: water for reuse, macronutrients (N, P, K) for fertilizer, dissolved metals (Cu, Zn, Ni, Ag, Au, Pt) for resale, cellulose and biopolymers for material markets, and energy carriers (biogas at 60–70% CH₄, bio-hydrogen, exported electricity). Verma et al. (2023) frame wastewater explicitly as a sustainable resource, not a waste stream, while Walling et al. (2022, IWA) lay out the engineering pathways that make the "treat-to-recover" model practical at plant scale.
What Industrial Wastewater Actually Contains — and What It's Worth
Industrial wastewater carries recoverable water, macronutrients, sulfur, dissolved metals, cellulose, biopolymers, and energy — and the concentrations vary by an order of magnitude across sectors (Walling et al., 2022, IWA). Food and beverage streams typically run 100–500 mg/L total nitrogen and 10–50 mg/L phosphorus; metal-finishing effluents carry 5–500 mg/L of heavy metals depending on rinse-water ratios; dairy and slaughterhouse streams push COD above 5,000 mg/L with recoverable protein fractions.
Despite this, global recovery rates remain below 20% for most macronutrients and below 5% for dissolved metals — a gap the 80%-treated-by-2030 target will not close on its own. Recovery requires unit operations bolted onto existing treatment trains, and the unit economics depend on commodity prices. Struvite (MgNH₄PO₄·6H₂O) trades at $300–800/ton as a slow-release fertilizer; recovered copper at $6,000–9,000/ton; silver at $700–900/oz; reclaimed water at $0.50–2.00/m³ depending on purity tier. Battery-recycling leachate and electronics-stripping baths are the highest-value streams emerging through 2030 because they concentrate Ni, Co, and Li at recoverable grades.
| Resource | Typical Industrial Influent Range | Current Recovery Rate | 2026 Market Value |
|---|---|---|---|
| Water (reuse grade) | 100% of flow | <30% industrial reuse | $0.50–2.00/m³ |
| Total Nitrogen (N) | 50–500 mg/L (food/dairy) | <20% | $200–500/ton N equivalent |
| Phosphorus (P) | 10–50 mg/L (food), 5–30 mg/L (municipal) | <20% | $300–800/ton as struvite |
| Copper (Cu) | 5–200 mg/L (finishing) | <5% dissolved | $6,000–9,000/ton |
| Silver (Ag) | 1–50 mg/L (electronics) | <5% | $700–900/oz |
| Cellulose/fiber | 500–5,000 mg/L (pulp/paper) | <15% | $200–600/ton dried |
| Biogas (energy) | 0.20–0.35 Nm³/kg COD removed | Varies | $0.05–0.15/kWh CHP |
The Five Core Recovery Technologies — and How They Compare
Five unit operations cover roughly 90% of industrial resource-recovery installations through 2030, and they are best understood as complementary, not competing. Bioelectrochemical systems (BES) exploit microorganism-electrode interactions to recover energy, hydrogen, nutrients, and value-added chemicals simultaneously with low sludge yield (Frontiers of Environmental Science & Engineering, 2018); BES sits at TRL 6–7 and is the most active 2026–2030 innovation frontier. Anaerobic digestion (AD) and UASB reactors are TRL 9 workhorses producing biogas at 60–70% CH₄ and ~20–25 MJ/Nm³ energy content, with the option to add struvite precipitation on the digestate liquor for P recovery. Struvite precipitation — controlled Mg:N:P dosing in a crystallizer — is TRL 9, low-risk, and delivers a sellable fertilizer product. MBR + RO hybrids deliver water reuse at sub-micron filtration and TRL 9, the default pairing for any plant under water-scarcity pricing. Algae and biofilm photobioreactors (TRL 6–7) strip N and P into biomass that can be sold as feed or biofertilizer.
No single technology wins on every stream, and the engineering default through 2030 is a paired train: AD + struvite on high-P food waste, MBR + RO for water reuse, BES for energy-positive polishing on low-strength streams. Emerging options to track in 2026 include capacitive deionization for selective ion recovery from mining brine, bioelectrochemical H₂ production, and closed-loop critical-mineral recovery from battery leachates.
| Technology | Mechanism | Best-Fit Stream | Primary Recovery | TRL (2026) | Maturity Risk |
|---|---|---|---|---|---|
| Bioelectrochemical Systems (BES / MFC / MEC) | Microorganism-electrode electron transfer | Low-to-medium strength industrial, municipal polishing | Energy, H₂, nutrients, chemicals | 6–7 | Scale-up, electrode cost |
| Anaerobic Digestion / UASB | Microbial conversion in O₂-free reactor | High-COD food, dairy, brewery, pulp | Biogas (60–70% CH₄) | 9 | Low — proven |
| Struvite Precipitation | Controlled Mg:N:P stoichiometric dosing | High-P digestate liquor, slaughterhouse | Struvite fertilizer (P recovery 70–90%) | 9 | Low |
| MBR + RO Hybrid | Bioreactor + reverse osmosis membrane stack | Water reuse across all sectors | Reuse water 95–99% recovery | 9 | Low — fouling management |
| Algae / Biofilm Photobioreactor | Photosynthetic N/P uptake into biomass | Low-to-medium strength, CO₂-rich flue gas | Biomass, N/P removal | 6–7 | Contamination, land area |
CAPEX, OPEX and 2026–2030 ROI by Technology
Capital committees want numbers, and the 2026 envelope for each technology is narrow enough to underwrite. BES systems run $1,500–4,000 per m³ of reactor volume, with OPEX dominated by electrode replacement on a 5–8 year cycle; standalone payback is 5–8 years but drops to 2–3 years when co-recovery credits (energy + H₂ + struvite) are stacked. Struvite crystallization for a 1,000 m³/d plant sits at $200,000–$1.2M CAPEX, with OPEX dominated by MgCl₂ dosing and a 3–5 year payback when fertilizer revenue is captured. MBR + RO reuse loops run $800–2,500 per m³/d of capacity with OPEX at $0.20–0.55/m³; payback is 2–4 years wherever water-scarcity pricing or freshwater-discharge fees apply, and the dewatered sludge stream is best finished through a plate and frame filter press for sub-65% moisture cake that meets landfill or incineration thresholds. Anaerobic digestion CAPEX runs $1,200–3,000/m³ and OPEX returns $0.05–0.15/kWh via combined heat and power, with a 4–7 year payback that compresses at higher electricity tariffs.
One macro signal worth pricing in: at 11.0% CAGR the global market roughly doubles by 2030, and equipment cost deflation of 3–5% per year is normal for fast-scaling categories. Staged CAPEX deployment — piloting in 2026, scaling in 2028 — captures that deflation rather than paying 2026 list prices for 2030 capacity.
| Technology | CAPEX Range | OPEX Range | Standalone Payback | Key Cost Lever |
|---|---|---|---|---|
| BES | $1,500–4,000 / m³ reactor | Electrode replacement 5–8 yr | 5–8 yr (2–3 yr stacked) | Electrode material cost |
| Struvite Crystallizer | $200K–$1.2M (1,000 m³/d plant) | MgCl₂ dosing dominant | 3–5 yr | Fertilizer sale price |
| MBR + RO Reuse Loop | $800–2,500 / m³/d capacity | $0.20–0.55 / m³ | 2–4 yr | Membrane life, energy |
| Anaerobic Digestion / UASB | $1,200–3,000 / m³ | Returns $0.05–0.15 / kWh CHP | 4–7 yr | Biogas utilization tariff |
Matching Technology to Industry — A 2026 Buyer's Map
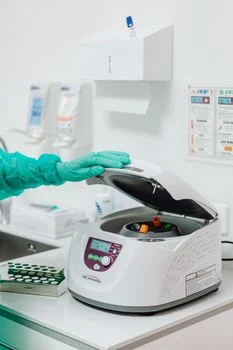
The fastest path from influent audit to vendor shortlist is sector-by-sector. Food, beverage, and dairy pair anaerobic digestion for biogas with struvite precipitation for P recovery, finishing with an MBR membrane bioreactor system for water reuse. Metal finishing and electroplating run selective precipitation plus ion exchange plus RO; dissolved Cu, Zn, and Ni become a credit line against chemical-purchase costs. Battery recycling and electronics route leachates through hydrometallurgy with selective precipitation, with critical-mineral (Li, Co, Ni) recovery scaling fastest through 2030. Textile and dyehouse need Fenton or ozone pretreatment in front of MBR + RO for water reuse; dye-pigment recovery remains pre-commercial but is worth tracking. Pulp and paper uses UASB for COD reduction paired with a DAF system for fiber recovery — the recovered cellulose sells for $200–600/ton dried. Mining and metal refining under Zero Liquid Discharge pressure are piloting capacitive deionization and BES for brine valorization, covered in the parallel Zero Liquid Discharge adoption forecast to 2030.
Regulatory and Market Drivers Shaping the 2030 Forecast
The 11% CAGR is anchored in policy, not just optimism. The EU Urban Waste Water Treatment Directive recast (2024) mandates energy neutrality for plants above 100,000 PE by 2040, and resource recovery is the lowest-cost compliance path for utilities facing that deadline. China's 14th Five-Year Plan and the 2026 MEE wastewater action list push phosphorus recovery and zero-discharge in key watersheds including the Yangtze and Yellow River basins. In the US, Build America Buy America (BABA) and Inflation Reduction Act provisions fund domestic resource-recovery equipment, including BES and critical-mineral recovery. The circular water economy forecast to 2030 projects a $17.89B → $29.61B segment sitting inside the larger $591.2B WWT market, and the parallel data center water reuse forecast to 2030 is creating new industrial demand that pulls the same MBR + RO and ZLD supply chain.
The arithmetic is unforgiving: reaching 80% treated-wastewater coverage by 2030 means adding treatment capacity for tens of millions of m³ per day globally, and the cheapest way to fund that build is to attach a revenue-recovery unit operation to each new m³ — turning a capex line into a capex-with-payback line.
A Practical 2026–2030 Procurement Roadmap
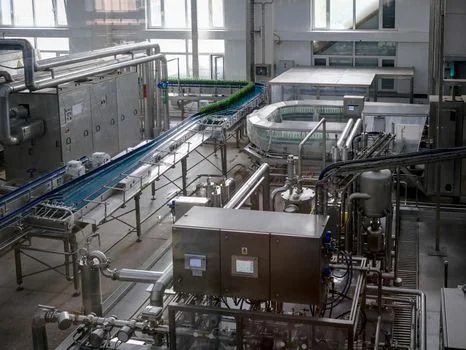
Capital moves in stages, and the recovery equipment roadmap should follow the same rhythm. Step 1 (2026): audit influent — characterize N, P, metals, COD, and energy content; benchmark current recovery rate against the table above; quantify the revenue gap. Step 2 (2026–2027): pilot low-CAPEX, fast-payback wins — struvite on high-P streams, DAF on fiber-bearing streams, MBR reuse loops where water-scarcity pricing exists. Step 3 (2027–2028): integrate AD or BES for energy-positive operation as electricity and heat prices rise through the decade. Step 4 (2028–2030): add selective metal recovery and closed-loop brine valorization once feed prices and ZLD mandates justify the higher CAPEX. Staged deployment captures the 3–5% per year equipment cost deflation implied by the 11.0% CAGR, and it lets operations teams learn each unit operation before the next one is bolted on.
Frequently Asked Questions
What is the projected ROI on struvite recovery in 2026? A 1,000 m³/d struvite crystallizer runs $200,000–$1.2M CAPEX with MgCl₂-driven OPEX and pays back in 3–5 years when fertilizer revenue is captured at $300–800/ton. A pilot on a high-P food or slaughterhouse stream is the right first step.
Which wastewater resource recovery technology has the best 2026–2030 ROI? MBR + RO reuse loops, with 2–4 year payback wherever water-scarcity pricing or discharge fees apply — the most defensible answer for most industrial buyers entering the market in 2026.
What is the global market size for resource recovery from wastewater by 2030? The water and wastewater treatment market reaches $591.2 billion by 2030 at 11.0% CAGR, with the circular water economy subsegment alone at $17.89B → $29.61B over the same window.
How much of global wastewater will be treated by 2030? Coverage is projected to rise from 55% in 2024 to 80% by 2030, and every additional m³ treated is an opportunity to attach a recovery unit operation to existing treatment trains.
Is bioelectrochemical system (BES) technology ready for industrial deployment in 2026? BES sits at TRL 6–7 — proven at pilot scale for simultaneous energy, H₂, and nutrient recovery, with full-scale industrial deployment expected to accelerate from 2027 onward as electrode costs fall.