What the Circular Water Economy Means for Industrial Water Users
The circular water economy is the systemic reduction, reuse, and recovery of water, energy, and nutrients from industrial and municipal wastewater streams, replacing the linear take-use-discharge model that has defined industrial water management for a century. Where conventional treatment optimizes for regulatory compliance on the discharge side, circular design optimizes for output: reclaimed process water, recoverable salts, biosolids for soil amendment, and biogas from anaerobic digestion. The shift is technical as much as philosophical. A facility that returns 70-80% of its process water to upstream loops is operating a different asset than one that pays for freshwater intake and discharge fees at both ends.
The pressure to make that shift is no longer theoretical. The UN's 2015 forecast projected that by 2030 global clean water demand will exceed supply by 40%, with up to half the world's population living in water-stressed regions (UN, 2015). That gap is now embedded in the UN Sustainable Development Goal framework — SDG 6 (clean water and sanitation) and SDG 17 (partnerships for the goals) — which have become the policy backbone for national reuse mandates from Brussels to Beijing. Industrial water users in manufacturing, food and beverage, textiles, and pharmaceuticals sit at the center of this shift: they are simultaneously the largest volumetric consumers of process water and the largest source of recoverable effluent. For a plant manager, that dual position is now a board-level ESG and CAPEX question, not a sustainability department aspiration.
Market Size, Growth Rate, and Regional Investment Through 2030
The water reuse segment of the circular water economy is forecast to grow from $17.89B in 2024 to $29.61B by 2030, a 10.6% compound annual growth rate. The broader circular water economy — including resource recovery, sludge-to-energy, and nutrient extraction — is growing at a comparable or higher rate, with some analyst segments projecting 11-13% CAGR through 2030. For industrial buyers, that trajectory means the equipment categories enabling circular outcomes are no longer niche; they are becoming default specifications in major CAPEX cycles.
Three regional policy blocks are driving the demand curve. The EU Water Reuse Regulation 2020/741, in force since June 2023, established harmonized minimum requirements for water reuse in agricultural irrigation and is now cascading into industrial reuse guidance through the EU Industrial Emissions Directive update (2024/1785). The US Infrastructure Investment and Jobs Act (IIJA) allocated $55B for water infrastructure through 2026, with $1B specifically earmarked for water recycling and reuse projects in the Colorado River Basin and other drought-stressed regions. China's 14th Five-Year Plan set a target of 25% wastewater reuse in water-stressed cities by 2025, with secondary reuse loops for industrial parks mandated in provincial implementation plans. MENA and India are the fastest-growing markets: Saudi Arabia targets 100% reuse of treated municipal wastewater by 2030, and India's Jal Jeevan Mission has catalyzed decentralized reuse demand across 4,000+ industrial clusters.
A new demand vector is tightening the supply picture further. The IEA's 2024 Global Hydrogen Review projects green hydrogen production will consume over 1.2 billion m³/year of ultrapure water by 2030, roughly the annual demand of a mid-sized European capital. That water must come from reuse or desalination, not freshwater abstraction, or the hydrogen transition simply trades a carbon problem for a water problem.
| Region | Key Policy / Investment Lever | 2030 Target or Allocation |
|---|---|---|
| European Union | Water Reuse Regulation 2020/741; Industrial Emissions Directive 2024/1785 | Harmonized reuse standards across all member states; binding minimum reuse quality for agricultural and industrial loops |
| United States | Infrastructure Investment and Jobs Act (2021); EPA Water Reuse Action Plan | $55B water allocation through 2026; $1B for recycling/reuse in drought basins |
| China | 14th Five-Year Plan; provincial reuse mandates | 25% wastewater reuse in water-stressed cities by 2025; industrial park closed-loop targets |
| MENA | Saudi Vision 2030; UAE Water Security Strategy 2036 | 100% reuse of treated municipal wastewater (KSA); 95% reuse in industrial parks (UAE) |
| India | Jal Jeevan Mission; Industrial cluster reuse guidelines | Decentralized reuse across 4,000+ industrial clusters; 20% recycle target for large industries |
The Industrial Technology Stack Enabling the Circular Water Economy
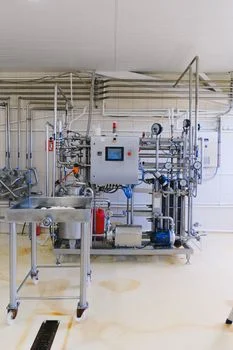
Six equipment categories define the circular water technology stack that industrial buyers must evaluate. Each solves a different part of the reuse equation, and the procurement decision is less about choosing one and more about specifying the right sequence.
MBR (Membrane Bioreactor). Submerged PVDF membranes at 0.1 μm pore size replace the secondary clarifier in conventional activated sludge. An MBR delivers a 60% smaller footprint than CAS at equivalent BOD load, effluent turbidity consistently below 1 NTU, and is the standard biological step before RO in any high-recovery reuse train. For a buyer evaluating MBR membrane bioreactor systems, the key specifications are membrane area, air-scour rate (typically 0.3-0.5 m³ air/m² membrane area/hour), and chemical cleaning tolerance. Pairing an MBR with submerged PVDF MBR membrane modules sized for peak influent flow is the most common configuration for food processing, pharmaceutical, and textile applications.
Reverse Osmosis (RO). Industrial RO achieves up to 95% recovery rate, producing permeate suitable for ultrapure loops in pharmaceutical, semiconductor, and food/beverage facilities. The design challenge is concentrate handling: at 75-95% recovery, the reject stream carries 5-25x the feed salinity and requires brine concentration, evaporation, or crystallization for zero-liquid-discharge (ZLD) pathways. Specifying industrial RO systems with up to 95% recovery means budgeting for concentrate management upfront, not retrofitting it after commissioning.
DAF (Dissolved Air Flotation). DAF is the standard pre-treatment for high-FOG and high-suspended-solids streams — food processing, meat and poultry, dairy, and refinery wastewater. Hydraulic retention times of 20-30 minutes and float removal efficiencies of 90%+ on TSS and FOG make DAF the right first stage before any biological or membrane step. DAF pre-treatment systems sized at 15-25% of total plant flow are typical for mixed industrial effluents.
MBBR and SBR. Moving Bed Biofilm Reactor and Sequencing Batch Reactor systems handle medium-to-high strength industrial wastewater (COD 2,000-10,000 mg/L) where footprint constraints rule out conventional activated sludge. MBBR carriers at 30-70% fill ratio deliver biomass concentrations 2-3x higher than CAS, with simpler operation and no sludge recirculation pumping.
Sludge-to-resource. Closing the solids loop requires dewatering. Sludge dewatering filter presses and centrifuges convert biosolids to cake at 20-35% dry solids, ready for landfill, incineration with energy recovery, or — under stricter circular KPIs — agricultural reuse as soil conditioner.
Disinfection. Closed reuse loops cannot rely on chlorination, which forms regulated DBPs (trihalomethanes, haloacetic acids) that concentrate in recirculating water. Chlorine dioxide disinfection for reuse loops and ozone provide pathogen control without DBP formation, and are now standard specifications in EU 2020/741-aligned reuse systems.
| Technology | Function in Circular Train | Key Operating Parameter | Typical Application |
|---|---|---|---|
| MBR | Biological treatment + solid-liquid separation | 0.1 μm pore; effluent turbidity <1 NTU; 60% footprint reduction vs CAS | Pre-RO polishing; direct reuse for non-contact loops |
| RO | Dissolved solids removal | Up to 95% recovery; permeate TDS <50 mg/L (single pass) | Ultrapure reuse in pharma, semiconductor, F&B |
| DAF | Pre-treatment (FOG, TSS removal) | 90%+ TSS/FOG removal; HRT 20-30 min | Food, meat, dairy, refinery pre-treatment |
| MBBR / SBR | Biological treatment of high-strength effluent | Biomass 2-3x CAS; carrier fill 30-70% | Textile, chemical, landfill leachate |
| Filter press / centrifuge | Sludge dewatering | Cake dryness 20-35% DS | Biosolids-to-resource, landfill diversion |
| ClO₂ / ozone | Disinfection in reuse loop | No DBP formation; Ct 0.5-2.0 mg·min/L | Pathogen control in closed-loop reuse |
Matching Technology to Industrial Effluent Profiles
Specifying the right technology mix depends on the effluent profile, not the industry label. A 1,000 m³/day food processing plant and a 1,000 m³/day textile dyehouse share a flow rate but not a treatment train.
Food processing and meat processing streams are characterized by high FOG (200-1,500 mg/L), high BOD (1,500-4,000 mg/L), and variable suspended solids. The standard circular train is DAF pre-treatment to remove FOG and TSS, followed by MBR for biological polishing, with RO on the MBR permeate for high-purity reuse loops. Sludge from the DAF float and MBR waste is dewatered for resource recovery. Pharmaceutical and semiconductor facilities prioritize water quality above all: RO — often double-pass — with upstream MBR to protect membrane life and extend CIP cycles. For ultrapure polishing, electrodeionization or CDI follows the RO train.
Textile and dyehouse effluent carries color, high COD (2,000-8,000 mg/L), and refractory organics. DAF handles suspended solids and color bodies upstream of biological treatment (MBBR or SBR), with RO on the secondary effluent for reuse. Anti-fouling pretreatment — typically UF between the MBR and RO — is non-negotiable for textile applications to protect the RO membrane surface. Oil and gas and petrochemical facilities are the primary ZLD users: DAF for FOG removal, MBR for biological polishing, and RO or thermal evaporation for brine concentration, with crystallization as the final solidification step. Rural and decentralized industrial parks — common in India, Southeast Asia, and parts of Africa — are best served by package integrated sewage treatment systems or compact MBBR units with built-in disinfection, sized for small-flow closed-loop reuse. Adding multi-media filtration upstream of the membrane train extends membrane life in variable influent conditions.
2026–2030 Procurement Framework for Industrial Buyers
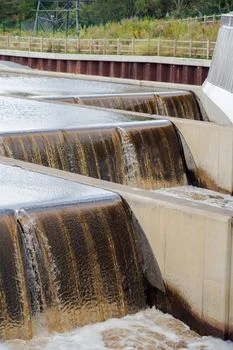
Translating the forecast into a CAPEX plan requires phasing. The buyers who will hit 2030 reuse and ESG targets are the ones starting pilot work in 2026, not the ones issuing tenders in 2029.
Phase 1 (2026): Audit and pilot. Conduct a facility water balance to identify the highest-value reuse opportunities — typically cooling tower make-up, boiler feed, and process rinse water. Specify a pilot-scale MBR or RO skid sized at 5-10% of target reuse flow, with influent characterization data driving the full-scale design. Phase 2 (2027–2028): Scale deployment. Budget $0.8M–$5M for a typical 500–2,000 m³/day industrial reuse plant, with cost driven by technology mix: MBR-only reuse loops sit at the low end ($0.8-1.5M), full MBR-RO trains with disinfection at the mid range ($2-3.5M), and ZLD configurations with thermal brine concentration at the upper end ($3.5-5M+). Phase 3 (2029–2030): Integrate resource recovery. Add sludge-to-energy (anaerobic digestion with CHP), nutrient recovery (struvite precipitation for phosphorus), and water reuse KPIs into the facility's ESG reporting. Specify equipment compliant with EU 2020/741, US EPA Water Reuse Guidelines, and ISO 46001 water efficiency management to future-proof against tightening regulation.
Industrial buyers planning CAPEX in this window should align their specifications with the broader water reuse market forecast to 2030, the parallel decentralized wastewater treatment 2030 forecast for multi-site operations, and the emerging green hydrogen water demand forecast to 2030 if electrolysis capacity is on the facility roadmap.
Frequently Asked Questions
How big is the circular water economy in 2030?
The water reuse segment is forecast to reach $29.61B by 2030, growing from $17.89B in 2024 at a 10.6% CAGR. The broader circular water economy, including sludge-to-resource and nutrient recovery, is growing at a comparable or higher rate (11-13% CAGR), driven by EU 2020/741, the US IIJA's $55B water allocation, and China's 25% reuse target.
What is the best wastewater reuse technology for industry?
There is no single best technology — the right train depends on effluent profile. For high-FOG food and meat processing, DAF + MBR is standard. For pharmaceutical and semiconductor, MBR + double-pass RO delivers ultrapure reuse. For textile and dyehouse, DAF + MBBR + RO with anti-fouling pretreatment is the established configuration. ZLD applications in oil and gas use DAF + MBR + RO or thermal evaporation.
How much does an industrial water reuse system cost?
A typical 500–2,000 m³/day industrial reuse plant budgets between $0.8M and $5M depending on technology mix. MBR-only reuse loops sit at $0.8–1.5M, full MBR-RO trains with disinfection at $2–3.5M, and ZLD configurations with thermal brine concentration at $3.5–5M+. Piloting at 5-10% of target flow in 2026 is the most cost-effective way to derisk full-scale CAPEX.
What regulations drive circular water investment through 2030?
Three policy blocks are the primary demand drivers: EU Water Reuse Regulation 2020/741 (harmonized agricultural and industrial reuse standards), the US IIJA's $55B water infrastructure allocation through 2026, and China's 14th Five-Year Plan 25% reuse mandate in water-stressed cities. ISO 46001 water efficiency management is becoming the procurement specification standard for global manufacturers.