How big is the wastewater-biogas market in 2026?
The global biogas from wastewater market is estimated at USD 14–17 billion in 2026, representing roughly 18–24% of the total biogas industry, and is forecast to grow at a 6–8% CAGR through 2030. Growth is driven by EU RED III biomethane targets, US IRA Investment Tax Credits, and industrial AD capacity additions across Asia.
The figure is built bottom-up from installed anaerobic digestion capacity (m³/day) in municipal and industrial plants, multiplied by regional tariff and feed-in tariff values, then adjusted by the upgrading attach rate — the share of biogas plants that actually install a biomethane upgrading skid rather than flaring or using raw gas in a CHP. Cross-checked against IEA Bioenergy's 2024–2025 global biogas inventory, the band lands between USD 14 billion (conservative, low upgrading attach) and USD 17 billion (high attach, including amine and membrane retrofits on legacy sites). The 6–8% CAGR is below the 12–14% rate seen in 2020–2023 for two structural reasons: EU landfill-gas capacity has matured, and OECD permitting cycles have lengthened to 18–30 months per project (source: IEA Bioenergy 2024-11). Asian capacity additions, especially China industrial-park AD and India municipal SBM 2.0 plants, offset most of the OECD slowdown but not all of it. 2026 is also the first reporting year under EU RED III's revised biomethane sub-target of 35 bcm by 2030, which sets the policy anchor for every capex model built this year.
Regional breakdown: who owns the 2026 capacity?
Europe holds 35–40% of 2026 wastewater-biogas capacity, Asia-Pacific 25–30%, North America 18–22%, and Latin America plus Middle East & Africa a combined 10–12% (source: EurObserv'ER 2024 Biogas Barometer, cross-checked with IEA Bioenergy 2024-11). The EU dominance rests on >20,000 operating AD plants — roughly two-thirds of them in Germany, Denmark, and France — fed by municipal sludge, manure, and food-industry waste streams under the RED III framework.
Asia-Pacific is the fastest-growing block. China's industrial-park AD capacity exceeded 30 million m³/day in 2025, with a marginal COD-to-biogas conversion rate of 0.35–0.45 m³ biogas per kg COD removed at mesophilic conditions (35–38 °C). India is adding 50–80 municipal AD plants per year under the SBM 2.0 programme, mostly CSTRs in the 1–5 MLD range. North America's 18–22% share is levered by the US IRA Section 48 Investment Tax Credit: a 30% base credit with a 10% domestic-content adder where applicable, effectively shortening AD plant payback by 1.5–3 years on a 7-year base case. Latin America's standout is Brazil, where sugarcane vinasse AD is the single largest feedstock stream — over 2 billion m³ of biogas potential per harvest from ethanol distilleries.
| Region | 2026 share of WW-biogas market | 2026 installed AD capacity (m³/day) | Key policy driver |
|---|---|---|---|
| Europe (EU 27 + UK) | 35–40% | ~22 million | RED III biomethane sub-target 35 bcm by 2030 |
| Asia-Pacific | 25–30% | ~38 million (China-led) | China carbon neutrality 2060; India SBM 2.0 |
| North America | 18–22% | ~9 million | US IRA Section 48 ITC (30% + 10% adder) |
| Latin America + MEA | 10–12% | ~6 million | Brazil RenovaBio; Saudi Vision 2030 |
Technology mix: from lagoon to high-rate AD in 2026
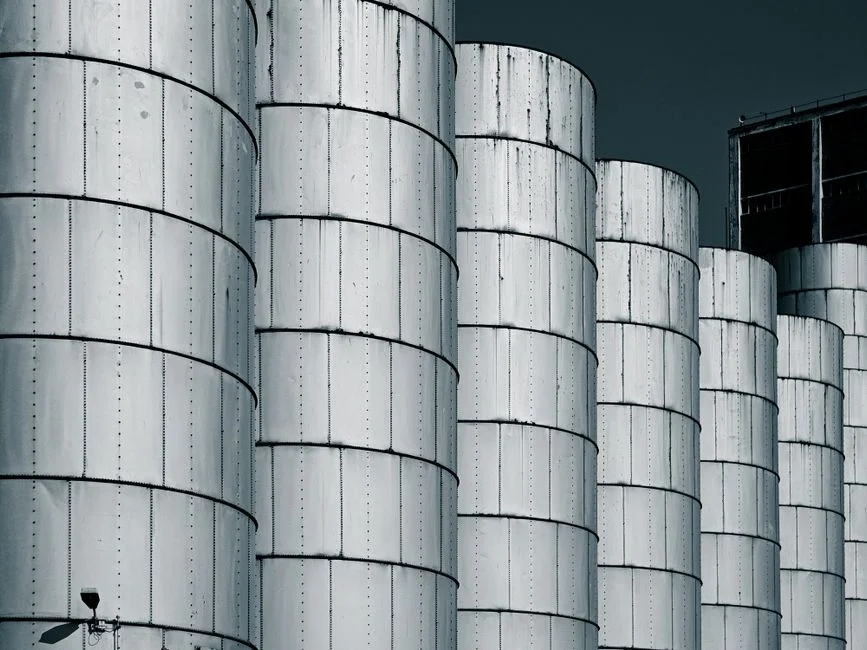
Reactor selection in 2026 is driven by influent COD concentration, not by volume alone. Four technology classes cover >90% of installed capacity, and each maps to a different wastewater strength band. Covered anaerobic lagoons handle streams below 3,000 mg/L COD at capex of USD 50–150 per m³ wastewater treated — the lowest-cost option but the lowest biogas yield per unit area. CSTRs (continuous stirred tank reactors) run at 10–20 days HRT and dominate food & beverage sludge applications; capex is USD 250–600 per m³, and they tolerate the highest solids loading of any mainstream AD class.
UASB (upflow anaerobic sludge blanket) and EGSB (expanded granular sludge bed) reactors are the workhorses for sugar, brewery, starch, and pulp & paper streams: 4–12 hour HRT, 0.8–1.2 kWh biogas per kg COD removed, and a footprint roughly one-fifth of an equivalent CSTR. AnMBR (anaerobic membrane bioreactor) is the emerging class, producing sub-0.1 μm effluent suitable for direct water-reuse coupling; capex runs 20–35% above a comparable CSTR, but the saved aerobic polishing step offsets 30–50% of that premium in water-stressed regions. Reactor selection rule: below 3,000 mg/L COD go lagoon or AnMBR; 3,000–15,000 mg/L COD go UASB/EGSB; above 15,000 mg/L COD with high suspended solids go CSTR.
| Reactor class | HRT | Influent COD (mg/L) | Capex (USD/m³ treated) | Typical biogas yield |
|---|---|---|---|---|
| Covered anaerobic lagoon | 20–40 days | <3,000 | 50–150 | 0.10–0.25 m³ CH₄/kg COD |
| CSTR | 10–20 days | 15,000–80,000 | 250–600 | 0.30–0.40 m³ CH₄/kg COD |
| UASB / EGSB | 4–12 hours | 3,000–15,000 | 200–500 | 0.28–0.38 m³ CH₄/kg COD |
| AnMBR | 12–48 hours | 2,000–15,000 | 300–800 | 0.30–0.42 m³ CH₄/kg COD |
What does the equipment buyer actually need to specify in 2026?
A 2026 procurement specification is a four-block document: pre-treatment, reactor, upgrading, and CHP. Pre-treatment starts with a rotary mechanical bar screen for AD pre-treatment sized to a 6 mm aperture, paired with grit removal to protect downstream digester mixers and heat exchangers. Skipping this step typically costs operators 8–15% of annual biogas yield through rags blinding and pump downtime.
Biogas conditioning sits between the reactor and the engine or upgrading skid: H₂S removal to <200 ppm is mandatory before any CHP or PSA inlet, achieved by iron-oxide media beds (small plants) or biological scrubbers (large plants). For the upgrading block, the buyer must choose between water scrubbing, PSA, membrane, and amine scrubbing — the comparison is detailed in the next section. CHP sizing follows a single rule: 1.5–2.0 kWe per m³/h of biogas at 60% CH₄ content, with electrical efficiency of 35–42% and thermal recovery of 40–50%. A 1,000 Nm³/h biogas plant yields a 1.0–1.3 MWe CHP module with a heat-recovery skid that offsets 60–80% of digester heating demand. Digestate handling closes the loop, and a filter press for AD digestate dewatering sized to 25–35% dry-solids cake cuts hauling costs by 50–70% versus liquid disposal.
Biogas upgrading and biomethane: the 2026 technology map
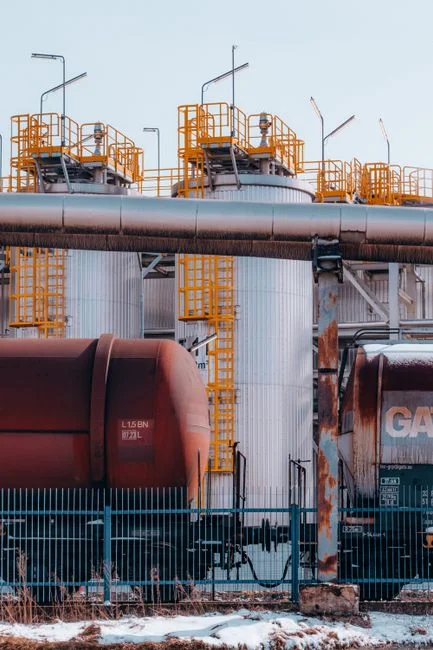
Biomethane upgrading in 2026 is dominated by three technologies — water scrubbing, PSA, and membrane — with chemical (amine) scrubbing losing share on solvent-handling regulation. Water scrubbing produces 95–98% CH₄ output at the lowest capex of USD 800–1,500 per Nm³/h, but it is water-intensive (2–4 m³ water per Nm³ biogas) and only competitive at <500 Nm³/h scale. PSA (pressure swing adsorption) hits 95–98% CH₄ at USD 1,200–2,500 per Nm³/h and is the best fit for 500–3,000 Nm³/h plants; parasitic load is low (0.20–0.30 kWh/Nm³) and methane slip is 1.5–3.0%.
Membrane upgrading delivers 95–97% CH₄ at USD 2,000–3,500 per Nm³/h, with a modular footprint suited to >3,000 Nm³/h plants or mobile skid retrofits. The dominant 2026 trend is hybrid PSA + membrane: PSA does the bulk CH₄ recovery, a polishing membrane captures residual slip, and the combined methane slip falls below 1.0% — the threshold most grid-injection tariffs now require. Amine scrubbing retains niche use in plants with high CO₂ partial pressure, but the EU's revised solvent-emission directive is forcing retrofits on >60% of installed amine units through 2027.
| Technology | CH₄ purity | Capex (USD/Nm³/h) | Methane slip | Best-fit plant scale |
|---|---|---|---|---|
| Water scrubbing | 95–98% | 800–1,500 | 1.0–2.0% | <500 Nm³/h |
| PSA | 95–98% | 1,200–2,500 | 1.5–3.0% | 500–3,000 Nm³/h |
| Membrane | 95–97% | 2,000–3,500 | 2.0–5.0% | >3,000 Nm³/h or mobile |
| Hybrid PSA + membrane | 97–99% | 2,500–4,000 | <1.0% | Grid-injection sites |
| Amine (chemical) | 96–99% | 1,500–2,800 | 0.1–0.5% | Niche, high-pressure CO₂ |
Capex and ROI benchmarks for a 2026 industrial AD plant
Turnkey industrial AD plant capex sits in the USD 350–900 per m³/d installed-capacity band for 2026 builds, with UASB/EGSB at the lower end (USD 350–550), CSTR in the middle (USD 500–750), and AnMBR or high-rate AD at the upper end (USD 700–900). These figures include pre-treatment, reactor, gas holder, CHP, and basic grid connection — upgrading skids are quoted separately at the rates in the previous section.
Payback windows are 4–8 years for food & beverage, where high COD concentrations drive strong biogas yields, and 6–10 years for municipal sludge where yields are lower but tipping-fee revenue offsets capex. A 1–3 year reduction applies where the IRA Section 48 ITC (30% + 10% domestic-content adder), an EU biomethane feed-in tariff of EUR 80–140/MWh, or voluntary carbon-credit revenue of USD 8–15 per tCO₂e is stacked. O&M typically runs 8–14% of capex per year, with membrane replacement (every 5–7 years) and CHP major overhauls (every 20,000–25,000 operating hours) as the dominant recurring costs. The decision rule before sizing a reactor: qualify the feedstock COD variability and the offtake pathway first — both will change the reactor class and the upgrading choice, in that order.
2026–2030 forecast and what it means for buyers
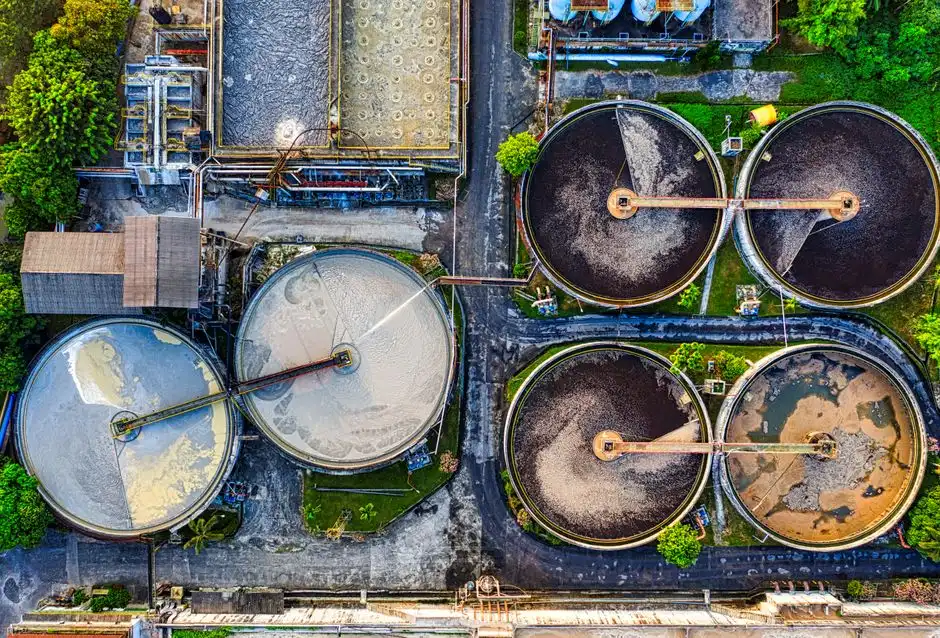
The base-case 2030 market value is USD 22–27 billion, with an upside scenario of USD 30+ billion if Asia industrial-park capacity and US IRA-linked projects both accelerate beyond current build rates. The downside floor is USD 19–20 billion if EU permitting bottlenecks persist past 2027.
Three buyer actions to take before 2027: first, lock in upgrading-skid lead times now — current delivery is 8–14 months for PSA and membrane skids and rising. Second, secure a biomethane offtake MoU before reactor sizing, because offtake purity specs (97% vs 99% CH₄) determine whether you need a single-stage or hybrid upgrading train. Third, validate feedstock COD variability across at least 6 months of influent data before FID — a 20% swing in COD drives a 15–25% swing in biogas revenue and can flip a CSTR to a UASB selection on the same plant. For buyers benchmarking distributed treatment options, the decentralized wastewater treatment 2026 outlook and the resource recovery from wastewater trends 2026 deep-dives cover the offtake and reuse economics in more detail. Distillery and high-strength industrial streams are covered separately in the MBR for distillery wastewater 2026 engineering guide.
Frequently Asked Questions
How big is the wastewater biogas market in 2026? The 2026 market is estimated at USD 14–17 billion, representing 18–24% of the total global biogas industry. The figure is derived bottom-up from installed AD capacity multiplied by regional tariff values and the upgrading-skid attach rate, cross-checked against IEA Bioenergy's 2024–2025 global inventory.
What CAGR is forecast for wastewater-origin biogas through 2030? The base-case 2026–2030 CAGR is 6–8%, slower than the 12–14% seen in 2020–2023 because EU landfill-gas capacity has matured and OECD permitting cycles have lengthened. Asian industrial AD additions offset most but not all of that OECD slowdown.
Which region has the most wastewater biogas capacity in 2026? Europe leads with 35–40% of global capacity, anchored by >20,000 operating AD plants in Germany, Denmark, and France. Asia-Pacific is second at 25–30%, led by China's >30 million m³/day industrial-park AD fleet. North America is third at 18–22%, levered by the US IRA Section 48 ITC.
How much does a 2026 industrial AD plant cost per m³/d? Turnkey capex ranges USD 350–900 per m³/d installed capacity, with UASB/EGSB at the low end and AnMBR at the high end. Payback is 4–8 years for food & beverage and 6–10 years for municipal sludge, shortened by 1–3 years where tax credits, feed-in tariffs, or carbon-credit revenue stack.
What is the most common biogas upgrading technology in 2026? PSA dominates the 500–3,000 Nm³/h mid-scale segment with 95–98% CH₄ purity at USD 1,200–2,500 per Nm³/h. Membrane is the standard above 3,000 Nm³/h and for mobile units. Water scrubbing holds the sub-500 Nm³/h small-plant segment on lowest capex. The 2026 trend is hybrid PSA + membrane for grid-injection sites requiring methane slip below 1.0%.