Why Resource Recovery from Wastewater Became a 2026 Capex Priority
Resource recovery from wastewater in 2026 is defined by eight commercially mature streams: FOG/biodiesel feedstock, precious metals, struvite (P), lithium, biogas, cellulose, industrial heat, and reuse water. After a decade in which Lux Research judged phosphate and lithium uneconomic, 2025–2026 price shifts have flipped the economics, pushing typical payback windows to 2–6 years for FOG and struvite and 4–9 years for lithium (per Lux Research, 2010s baseline; 2026 estimates: HydropureWater field data).
Lux's earlier reporting documented a long-arc price surge — FOG, oil, and precious-metal values rose more than 250% over the prior decade while crude oil roughly tripled — yet the same analysts concluded that phosphate and lithium recovery still failed the payback test (source: Lux Research, "Recovering Valuable Resources from Wastewater," reported via Envirotech Online). Three things changed by 2026: phosphate rock prices broke through the $150/t threshold on supply concentration in Morocco and China; battery-grade lithium carbonate (Li₂CO₃) rebounded above $15/kg after the 2024 correction; and both materials were listed as strategic under the EU Critical Raw Materials Act 2024, which changes the permit math for any plant discharging more than 10 m³/d.
The resource pool is enormous. Approximately 80% of wastewater globally is discharged untreated (source: Springer 2023, "Resource Recovery from Wastewater Through Biological Methods"), and that volume carries recoverable N, P, Li, organics, and metals that the 2010s baseline dismissed as uneconomic. Three regulatory frameworks now force the issue at the plant level: the EU UWWTD recast (2024 update with enforced recovery obligations), China's Zero Waste City program (now covering 100+ cities as of 2025), and the US EPA WRAP 2.0 framework (published 2025) tying NPDES permit renewal to recovery planning. For a 2026–2028 capex case, those three instruments are no longer background — they are the line items that change payback from a stretch to a defensible number.
The 8 Resource Recovery Streams Defining 2026 Industrial Wastewater
Eight streams now clear the commercial bar. The table below summarizes target contaminant, typical 2026 influent range, recovery yield, and product value; the bullets that follow explain where each one wins.
| Stream | Target Contaminant | Influent Range | Recovery Yield | Product Value (2026) | Typical Payback |
|---|---|---|---|---|---|
| FOG (biodiesel/tallow) | Fats, oils, grease | 500–10,000 mg/L | 60–85% | $0.40–$0.90/kg | 1.5–3 yr |
| Precious metals (Au, Ag, Pt, Pd, Cu) | Dissolved/particle metals | 1–500 mg/L | 90–99% | Market spot | 1–4 yr |
| Struvite (MAP/MKP) | NH₄⁺ + PO₄³⁻ | 50–500 mg/L P | 70–90% | $0.18–$0.35/kg | 2–5 yr |
| Lithium (Li₂CO₃/LiOH) | Li⁺ in brine/Rinse | 20–200 mg/L Li | 80–95% | $15–$25/kg Li₂CO₃ | 4–9 yr |
| Biogas (CH₄) | COD, BOD | 3,000–30,000 mg/L COD | 60–80% COD→CH₄ | $0.30–$0.60/m³ CH₄ | 4–8 yr |
| Cellulose/textile fiber | Suspended fibers | 200–5,000 mg/L TSS | 70–90% | $0.10–$0.40/kg | 3–6 yr |
| Process heat + reuse water | Thermal energy + H₂O | RO concentrate, blowdown | 50–80% reuse | $0.50–$2.00/m³ offset | 2–5 yr |
| N fertilizer (ammonium sulfate) | NH₄⁺ side-stream | 200–2,000 mg/L N | 80–95% | $0.20–$0.50/kg N | 3–6 yr |
FOG. Fats, oils, and grease at 500–10,000 mg/L are the easiest win; biodiesel's constrained feedstock supply is what pushed the value past the recovery threshold (per Lux). A DAF system for FOG and oil recovery typically pulls 60–85% before downstream polishing, and product exits as tallow equivalent at $0.40–$0.90/kg.
Precious metals. Electroplating and electronics rinse water carry 1–500 mg/L of Au, Ag, Pt, Pd, and Cu. With prices up more than 250% over the decade (per Lux), ion exchange and electrowinning stacks recover 90–99% at sub-3-year payback, often with a single precious-metal hit paying the entire skid.
Struvite. High-ammonium and high-phosphate streams from food, fertilizer, and landfill leachate respond to fluidized-bed crystallization at 70–90% P recovery, yielding MAP or MKP at $0.18–$0.35/kg. Payback is 2–5 years when sludge-handling savings are included.
Lithium. Battery and brine waste streams at 20–200 mg/L Li are the 2026 wildcard — selective adsorption and membrane trains now hit 80–95% recovery, and 4–9-year payback is credible only above 50 mg/L Li in feed.
Biogas. Anaerobic digestion of food, brewery, and pharma wastewaters at 3,000–30,000 mg/L COD produces 0.30–0.45 m³ CH₄/kg COD removed; revenue is $0.30–$0.60/m³ CH₄ depending on offtake.
Cellulose/fiber. Pulp & paper and textile mills recover 70–90% of suspended fiber at $0.10–$0.40/kg; 2026 pilots combine mechanical micro-screening with enzymatic hydrolysis to upgrade the product (extends Springer 2023 biological-methods coverage).
Process heat and reuse water. Cooling-tower blowdown and RO concentrate are now treated as a heat-and-water resource under EPA WRAP 2.0, with reuse values of $0.50–$2.00/m³ offsetting fresh-water intake.
Nitrogen fertilizer. Side-stream deammonification and air-stripping produce ammonium sulfate solution at 80–95% N recovery, $0.20–$0.50/kg N as fertilizer value.
Technology Map: Matching Influent Characteristics to Recovery Hardware
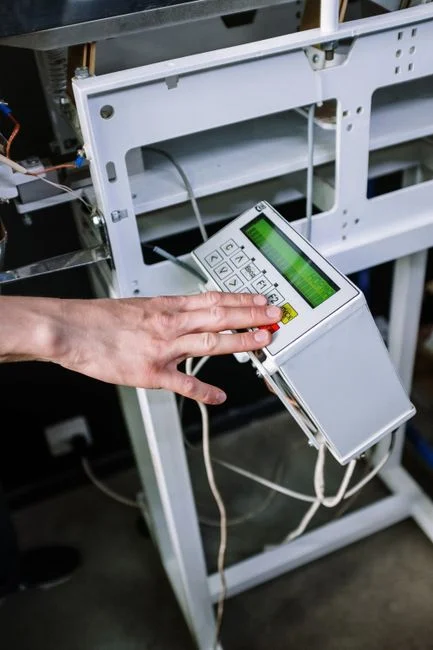
Recovery hardware divides into four families plus hybrids, and the family choice is set by influent concentration, not by stream alone. Below is the master map a process engineer uses to pick a unit operation before sizing it.
| Family | Unit Operations | Best-Fit Streams | Concentration Window | 2026 Footprint Note |
|---|---|---|---|---|
| Physical | DAF, dissolved gas flotation, micro-screening | FOG, suspended oils, cellulose fibers | >500 mg/L suspended | Lowest OPEX, emulsion limits apply |
| Chemical | Struvite precipitation, ion exchange, electrocoagulation, electrowinning | P/N, dissolved metals | >50 mg/L target ion | Chemical cost 8–18% of OPEX |
| Biological | Anaerobic digestion, algal-bacterial, fungal biosorption, BES | CH₄, P/N polishing, metals biosorption | Low to mid COD/N | HRT 6–30 days; footprint largest |
| Membrane | FO, RO, NF | Water reuse, Li concentration | Any; energy-driven | FO cuts energy 30–60% vs RO |
| Hybrid | MBR + side-stream struvite; DAF + AD; EC + IX | Most 2026 plant wins | Full range | 2-stage integration standard |
Decision rule of thumb: if the target contaminant is below 500 mg/L, default to membrane or biological; if above 2,000 mg/L, default to precipitation, anaerobic digestion, or electrochemical recovery. The 500–2,000 mg/L band is where 2026 plants most often deploy a hybrid — a DAF polish ahead of an MBR, or electrocoagulation ahead of ion exchange. For water reuse and lithium concentration specifically, the Forward Osmosis System Design Guide 2026: Engineering Specs, Costs & Zero-Risk Selection walks through the energy and concentrate-handling trade-offs; forward osmosis typically cuts specific energy 30–60% versus RO on high-fouling feeds. Fungal and bacterial biosorption (covered in the Springer 2023 biological-methods chapter) still belongs in the mix for low-grade metal polishing at 1–50 mg/L, where activated carbon and IX are uneconomic.
2026 Economics: CAPEX, Payback, and the ROI Math That Closes the Deal
Translate the technology map into a CFO-readable table before you translate it into a slide deck. Ranges below are 2026 estimates; the "pre-2025 baseline" column shows the Lux-era picture, so the delta is what the capex committee is actually voting on.
| Stream | 2026 CAPEX Range | 2026 Payback | Key Revenue Driver | Pre-2025 Baseline (per Lux) |
|---|---|---|---|---|
| FOG | $150K–$1.2M (10–100 m³/h) | 18–36 months | Tallow/biodiesel $0.40–$0.90/kg | Viable; constrained feedstock |
| Struvite | $400K–$3M | 2–5 years | Fertilizer + sludge handling offset | Uneconomic at 2010s P price |
| Biogas | $1M–$10M | 4–8 years | $0.30–$0.60/m³ CH₄ | Site-specific |
| Lithium | $5M–$50M | 4–9 years | Li₂CO₃ $15–$25/kg | Uneconomic at 2010s Li price |
| Precious metals | $200K–$2M | 1–4 years | Au/Ag/Pt/Pd spot (lux >250% rise) | Viable; price-driven |
Three line items move the payback math more than the technology does. First, regulatory non-compliance cost: under the EU UWWTD recast, fines scale with flow and discharge load; under China Zero Waste City, operating permits in 100+ cities now require a recovery plan; under EPA WRAP 2.0, NPDES renewal depends on it (per EPA WRAP 2.0, 2025). Those are recoverable cost offsets, not hypothetical. Second, freshwater and sludge-disposal tariffs have risen 30–60% across most US and EU jurisdictions since 2022, so the reuse-water and sludge-handling credits are larger than Lux's baseline assumed. Third, the EU Critical Raw Materials Act 2024 listing of phosphate and lithium effectively subsidizes recovery infrastructure through strategic-project fast-tracking — worth a real dollar value on the capex side that does not appear in the equipment quote.
Implementing Recovery in an Existing Plant: The 2026 Integration Path
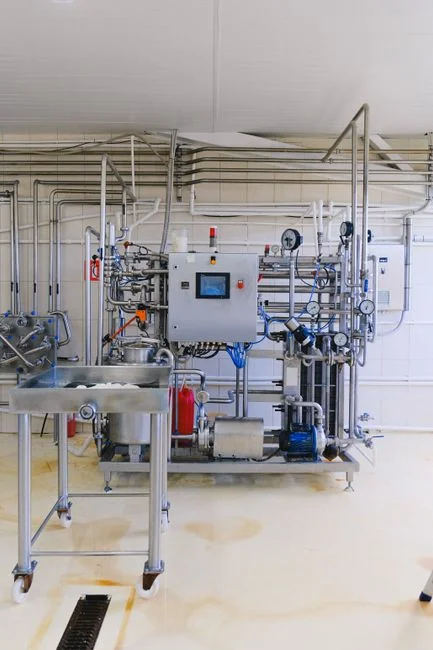
Recovery almost always gets scoped as a bolt-on and fails that way. A 2026 integration plan runs in three phases and a known list of failure modes. Phase 1 (months 0–3): influent characterization and recoverable-stream audit — composite sampling across at least two production campaigns, 24-hour flow-weighted, plus a mass-balance worksheet that ties flow, contaminant load, and product yield. Phase 2 (months 3–6): pilot skid at 1–5 m³/h — a DAF for FOG, a fluidized-bed reactor for struvite, or a forward osmosis cell for water reuse. Skipping the pilot is the most common reason FOG, struvite, and lithium projects miss their 2026 economics. Phase 3 (months 6–18): full-scale integration with the existing biological stage, including hydraulic split for side-stream reactors and sludge routing that does not double-handle solids.
Common failure modes in 2025–2026 retrofits: under-sizing because slug loads were never characterized, ignoring FOG emulsions that defeat a DAF designed for free oil, and treating the recovery skid as a peripheral line item rather than a process change. The integrations that pay back fastest pair recovery with reuse — for example, a MBR system for water-reuse recovery with a side-stream struvite reactor, or a DAF unit for FOG capture feeding a digester. For the broader purchasing decision, the Circular Water Economy 2026: Industrial Engineering Buyer's Guide covers how to align the capex package with permit renewal. Chemical dosing for struvite and metal recovery is the most overlooked sub-system — Mg:N:P stoichiometry off by 10% is the difference between 80% P recovery and a reactor full of useless sludge.
Frequently Asked Questions
Which wastewater resource-recovery streams are commercially viable in 2026? Eight: FOG, precious metals, struvite, lithium, biogas, cellulose fiber, process heat + reuse water, and nitrogen fertilizer — each with a payback under 9 years at current commodity prices and a published 2026 capex range (HydropureWater field data, 2026).
How did the EU UWWTD recast change the 2026 payback math? The 2024 update enforces recovery obligations tied to flow and discharge load, so non-compliance fines are now a directly recoverable cost offset on any capex model for plants discharging more than 10 m³/d into the EU network.
What is the cheapest resource-recovery retrofit in 2026? FOG capture via DAF at $150K–$1.2M for 10–100 m³/h, with payback of 18–36 months on tallow/biodiesel revenue (HydropureWater field data, 2026).
Is lithium recovery from wastewater economic in 2026? Yes, but only above 50 mg/L Li in feed; at 80–95% recovery and Li₂CO₃ above $15/kg, typical payback runs 4–9 years against $5M–$50M capex.
What does EPA WRAP 2.0 require of US plants in 2026? The 2025 framework ties NPDES permit renewal to a recovery plan, making reuse-water and heat-recovery offsets directly creditable against compliance cost (per EPA WRAP 2.0, 2025).