Why Coffee Processing Wastewater Needs Dedicated Design
Coffee processing wastewater is a high-strength, acidic, carbohydrate-rich stream, not a diluted food-industry effluent that municipal templates can absorb. Wet mills discharging pulp, mucilage sugars, pectins, tannins, and melanoidin pigments typically run at pH 3.5–5.5 and 25–35°C, with dark color that resists conventional biological oxidation alone (per the 2015 comprehensive review in Resources, Conservation and Recycling).
Wet-mill coffee effluent typically carries COD of 10,000–25,000 mg/L, BOD₅ of 5,000–15,000 mg/L, and peak-to-average flow of 2–3×. A defensible train uses screening, equalization, anaerobic digestion, aerobic polishing, and color removal only where melanoidins remain. Recirculation at 30–60% of fresh water demand raises equalization volume, anaerobic COD load, and alkalinity demand.
Wet processing generates most of the load. Sources include cherry reception washing, pulping, mucilage removal (mechanical or by fermentation), grading channels, and parchment washing. A wet mill commonly discharges 10–20 m³ of wastewater per ton of fresh cherry processed — a range cited across FAO and ICO wet-mill surveys and repeated in the 2015 review. Soluble coffee plants add evaporator condensate and spent-grounds leachate (typically COD 5,000–15,000 mg/L) that must either be segregated or routed through the same biological train.
Recirculation is the operational variable most engineers under-account for in design. Per the Springer 2021 recirculation study, returning process water "makes it even more polluting and can cause serious impacts if released into the environment without treatment" — dissolved solids, color, and organic load compound with each pass. Treat recirculation ratio (typically 30–60% of fresh water demand) as a hard design constraint: it raises the equalization tank volume, the COD loading on the anaerobic reactor, and the alkalinity demand, all of which must be specified before equipment purchase.
Coffee Wastewater Characteristics: 2026 Design-Basis Parameters
Coffee wastewater design tables for equalization, anaerobic reactors, aeration tanks, and sludge handling use the wet-mill and soluble-coffee bands below. Mucilage fermentation wastewater sits at the high end of each range for most plants we size in harvest season.
| Parameter | Wet mill (typical range) | Mucilage / fermentation (high end) | Soluble coffee condensate / leachate |
|---|---|---|---|
| COD (mg/L) | 10,000–25,000 | 20,000–30,000 | 5,000–15,000 |
| BOD₅ (mg/L) | 5,000–15,000 | 10,000–18,000 | 2,500–8,000 |
| BOD/COD ratio | 0.40–0.50 | 0.45–0.55 | 0.35–0.50 |
| TSS (mg/L) | 2,000–6,000 | 4,000–10,000 | 500–2,000 |
| VSS (mg/L) | 1,500–5,000 | 3,500–8,500 | 400–1,500 |
| Total nitrogen (mg/L) | 200–500 | 300–700 | 50–200 |
| Total phosphorus (mg/L) | 20–60 | 30–80 | 10–30 |
| pH | 3.5–5.5 | 3.0–4.5 | 4.0–6.5 |
| Color (Pt-Co) | 3,000–8,000 | 6,000–15,000 | 1,500–5,000 |
| Temperature (°C) | 25–35 | 25–32 | 30–55 (condensate) |
| Caffeine (mg/L) | 50–300 | 100–400 | 200–800 |
| Peak flow / average ratio | 2–3× | 2–4× | 1.2–1.5× |
The BOD/COD ratio of 0.40–0.50 confirms that coffee effluent is genuinely biodegradable once pH and temperature are controlled — anaerobic and aerobic biological stages will do most of the work, provided they are not choked by suspended solids or melanoidin shock loads. Color is the outlier: melanoidin polymers formed during roasting and high-temperature evaporation resist conventional biological oxidation and are the reason most 2026 designs include an ozone or AOP polishing step for soluble coffee plants.
From Cherry to Discharge: The 2026 Treatment Train
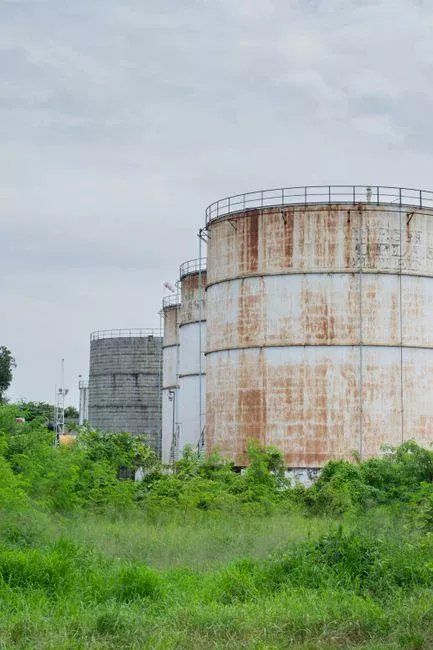
A defensible 2026 train for coffee wastewater combines physical, biological, and polishing stages. Each step below is paired with its design target so the engineer can validate the upstream number against the downstream limit.
Stage 1 — Screening and grit removal. Rotary bar screen at 2–5 mm openings captures cherry skins, husks, and grit that would otherwise blind pumps and accumulate in the equalization basin. A rotary mechanical bar screen for headworks sized for 2–3× peak flow is the standard specification; expect less than 5% of total COD removed here, but full protection of downstream equipment.
Stage 2 — Flow and pH equalization. An 8–24 hour HRT basin with mechanical mixing absorbs the 2–3× peak-to-average ratio typical of batch cherry arrivals. Automatic pH correction and coagulant dosing lifts pH into the 6.5–7.5 band the anaerobic stage needs. This is the stage where the recirculation penalty shows up first: a 50% recirculation ratio effectively doubles the required equalization volume and the NaOH or lime dose.
Stage 3 — Primary clarification / DAF. Dissolved air flotation removes 60–80% of suspended solids and 30–40% of COD before the biological stage, slashing the load on the anaerobic reactor. A DAF pre-treatment stage is standard for soluble coffee plants with high suspended solids, and is a defensible choice for wet mills above 200 m³/day.
Stage 4 — Anaerobic digestion (UASB or UAHR). Operated at 30–37°C with a 3–7 day HRT, the anaerobic stage delivers 70–85% COD removal and a biogas yield of 0.30–0.45 m³ CH₄ per kg COD removed (per the 2015 comprehensive review and the Journal of Material Cycles and Waste Management review). The upflow anaerobic hybrid reactor (UAHR) with intermittent aeration, documented in the 2015 review, combines high biomass retention with partial COD stabilization and is a strong fit for sites with variable influent.
Stage 5 — Aerobic polishing. A conventional activated-sludge stage followed by an MBR delivers effluent TSS ≤5 mg/L and COD ≤100 mg/L in roughly 60% of the footprint of CAS alone. An MBR polishing stage using DF-series submerged MBR modules also cuts the load on any downstream reuse or discharge polishing.
Stage 6 — Polishing and color removal. Ozone or AOP is required for residual melanoidin color in soluble coffee plants, where Pt-Co can otherwise remain in the 500–1,500 range even after MBR. The J. Material Cycles review documents removal efficiencies above 70% for color and 30–50% for residual COD at economically viable ozone doses. For full-cost context, see the AOP system operating cost guide.
Stage 7 — Sludge dewatering. Combined biological and physical sludge is dewatered on a plate and frame filter press for sludge dewatering to 25–35% DS cake, with filter area sized from 1–500 m² depending on plant throughput. The cake is suitable for composting or co-incineration with spent coffee grounds.
Choosing the Right Biological Stage for Coffee Effluent
Biological stage selection for coffee effluent drives most of the project CAPEX and the effluent compliance outcome. The table below compares the four options that actually appear in 2026 specifications for coffee plants.
| Technology | COD removal | Effluent TSS (mg/L) | Footprint | Energy use (kWh/m³) | Best fit |
|---|---|---|---|---|---|
| UASB | 70–85% | 50–150 | Small | 0.05–0.10 | Flows >500 m³/day, downstream aerobic polishing present |
| UAHR (hybrid) | 80–90% | 40–100 | Small–medium | 0.10–0.20 | Variable influent; documented for coffee (2015 review) |
| SBR | 85–95% | 20–50 | Medium | 0.40–0.60 | Batch operation, low-to-mid flows, no separate clarifier |
| MBR | 95–98% | ≤5 | Small | 0.60–1.20 | Discharge limit <250 mg/L COD or reuse credit >30% of OPEX |
Decision rule for the engineer: if the discharge limit is below 250 mg/L COD — typical for older EU summaries or for any site planning water reuse for washing or boiler feed — MBR is the only technology that reaches the target without a separate tertiary stage. If the limit is in the 400 mg/L COD band and no reuse credit exists, UASB or UAHR followed by a compact activated-sludge polish is the lowest lifecycle cost. MBR's higher energy demand (2–3× CAS) is recovered by 60–75% offset from the anaerobic stage's biogas when the plant exceeds roughly 1,000 m³/day of influent.
2026 CAPEX and OPEX Bands for a Coffee Wastewater Plant
Turnkey UASB + MBR budget bands for a wet mill or soluble coffee plant are expressed below in 2026 USD per m³/day of design capacity or per m³ treated. Most plants we size for mid-scale wet mills run toward the lower half of the CAPEX band when civil works are simple.
| Cost line | 2026 band | Driver / notes |
|---|---|---|
| CAPEX (turnkey, full train) | $180–$420 per m³/day | Site civil works and discharge pumping drive the upper end |
| OPEX (per m³ treated) | $0.18–$0.42 | Energy 40–55%, sludge hauling 20–30%, chemicals 10–15% |
| Anaerobic energy offset | 60–75% of aeration energy | Biogas for boiler or CHP at >1,000 m³/day influent |
| Sludge yield | 0.08–0.15 kg DS per kg COD removed | Lower end with DAF + anaerobic, higher with CAS alone |
| Sludge dewatering cost | $8–$18 per ton wet sludge | Plate and frame press at 25–35% DS cake |
The three highest-leverage design variables for cost are equalization tank size (drives CAPEX and alkalinity demand), recirculation ratio (drives the organic load on the anaerobic stage), and the final discharge limit (drives whether MBR or AOP is required). A 10% reduction in recirculation ratio typically lowers OPEX by 3–5% and reduces equalization volume proportionally.
Meeting 2026 Discharge and Reuse Standards
Discharge compliance for coffee plants in 2026 is governed by the local standard. The three jurisdictions below cover the bulk of soluble and wet-mill capacity in Latin America, Asia, and Europe.
| Standard | COD (mg/L) | BOD (mg/L) | TSS (mg/L) | pH | Color / O&G |
|---|---|---|---|---|---|
| Vietnam QCVN 40-MT/BTNMT (soluble coffee) | <400 | <100 | <200 | 5.5–9 | — |
| Brazil CONAMA 430/2011 | — | ≤120 (some states ≤60) | — | 5–9 | O&G ≤50 mg/L |
| EU BAT-AEL (Food & Beverage, 2010/75/EU) | ≤250 | — | — | — | TOC ≤40 mg/L |
Earlier industry summaries often cited COD ≤250 mg/L for EU food-and-drink context. According to Commission Implementing Decision (EU) 2019/2031, the FDM BAT-AEL for COD is 25–100 mg/L as a daily average for direct discharges to a receiving water body, with TSS 4–50 mg/L. An UASB + MBR train still meets Vietnam QCVN 40 and Brazil CONAMA 430 benchmarks without an AOP step. Soluble coffee plants aiming for the tighter EU direct-discharge COD band — or for any reuse credit — should plan for RO polishing downstream of the MBR; the recovered water is suitable for green-coffee washing, boiler feed, or landscape irrigation, and offsets 10–20% of the plant's total water footprint. For permit self-reporting, continuous BOD/COD/TSS analyzers are now standard — see the BOD online monitoring engineering guide for instrumentation specs. For Latin American buyers, the wastewater treatment plant supplier in Ecuador buyer's guide walks through regional sourcing and after-sales considerations.
Selection Checklist Before You Lock the Flowsheet
Coffee effluent projects stall when recirculation, peak factor, and the final permit limit are left open. Use this checklist before CAPEX approval:
- Measured COD, BOD₅, TSS, pH, and color on harvest-peak composite samples, not dry-season grab samples
- Recirculation ratio locked as a percentage of fresh water demand (design for 30–60%)
- Peak-to-average flow factor confirmed for cherry reception days (typically 2–3×)
- Equalization HRT sized for 8–24 h at the recirculation-adjusted COD load
- Discharge or reuse limit written as COD/BOD/TSS/pH (and color if the receiving water is sensitive)
- Anaerobic temperature control plan for 30–37°C and biogas use path above ~1,000 m³/day
- Sludge cake destination (compost or co-incineration) and dewatering to 25–35% DS
Who This Is For / Next Step
This guide is for plant engineers, EPC contractors, and procurement managers sizing wet-mill or soluble-coffee trains who need design-basis numbers, not brochure claims. Look elsewhere if you only need municipal package plants for low-strength sanitary sewage, or if your site has no biological treatment space and must haul untreated liquor. When recirculation ratio, peak factor, and the permit COD limit are known, request a sized UASB + MBR budget with equalization and sludge dewatering included via our coffee wastewater treatment inquiry form.
Frequently Asked Questions
What is the typical COD of coffee processing wastewater?
Wet-mill effluent typically runs 10,000–25,000 mg/L COD, with mucilage fermentation wastewater reaching 30,000 mg/L. Soluble coffee condensate and leachate are lower, at 5,000–15,000 mg/L. Those bands come from the 2015 review ranges and current soluble-plant operating data used for equalization and anaerobic sizing.
Is coffee wastewater biodegradable?
Yes. A BOD/COD ratio of 0.40–0.50 means biological treatment — anaerobic followed by aerobic — is the most cost-effective route, provided pH is corrected to 6.5–7.5 first. Color from melanoidins is the main non-biodegradable fraction and may need ozone or AOP after MBR on soluble plants.
What is the standard HRT for a UASB reactor on coffee effluent?
UASB reactors on coffee effluent are commonly sized for 3–7 days HRT at 30–37°C. That window delivers 70–85% COD removal and 0.30–0.45 m³ CH₄ per kg COD removed. The hybrid UAHR with intermittent aeration is the documented configuration for coffee in the 2015 review.
What is the 2026 CAPEX range for a coffee wastewater treatment plant?
Turnkey UASB + MBR trains budget at $180–$420 per m³/day of design capacity in 2026 USD. OPEX runs $0.18–$0.42 per m³ treated, dominated by aeration energy and sludge hauling. Anaerobic biogas offsets 60–75% of aeration energy at plants above 1,000 m³/day influent.
Which discharge standard applies to soluble coffee plants in Vietnam?
QCVN 40-MT/BTNMT sets COD <400 mg/L, BOD <100 mg/L, TSS <200 mg/L, and pH 5.5–9 for soluble coffee discharges. An UASB + MBR train meets all four without tertiary AOP, though color polishing is recommended for sites near receiving waters with low assimilative capacity.