Why Pesticide Wastewater Phosphorus Removal Is Unusually Hard
Organophosphorus pesticide wastewater carries total phosphorus loads of 30–800 mg/L paired with COD of 5,000–35,000 mg/L, a BOD/COD ratio typically below 0.25, and acute toxicity that wipes out the polyphosphate-accumulating organisms (PAOs) on which conventional enhanced biological phosphorus removal (EBPR) depends. In China alone, organophosphorus pesticide production accounts for roughly 7% of total national pesticide effluent (per the Docin review of organophosphorus pesticide wastewater treatment, 2017) — a small fraction by volume, but a disproportionately toxic one.
The core engineering problem is that the phosphorus in this matrix is split between two fundamentally different species: inorganic orthophosphate (PO₄³⁻) and esterified organophosphorus compounds such as parathion, methamidophos, glyphosate intermediates, and chlorpyrifos residuals. EBPR can only uptake free PO₄³⁻ through luxury uptake; the esterified fraction is not bioavailable and will pass through an A²O or SBR unchanged. Passive systems are no better — pilot-scale constructed floating wetlands (CFW) loaded with agricultural runoff removed only 27.4–83.6% of total nutrients and 12.4–42.7% of pesticides over a 16-week run (per the Springer Water Resources Management wetland study, 2024), which is not defensible against a discharge permit.
The 2026 compliance floor is therefore the design driver: China GB 21523 sets TP ≤0.5 mg/L for surface-discharging agrochemical plants, and the EU BAT-AEL for agrochemical discharges sits at TP ≤2 mg/L. Reaching those numbers from a 200 mg/L influent with a mixed P species profile requires pre-oxidation to crack the ester bond, chemical precipitation to drop the bulk load, and a polishing stage — biological or crystallizing — to clear the last milligram per litre.
Influent Characterization: What Your Pesticide Plant Actually Discharges
Pesticide plant effluent is not a single stream — it is the combined discharge from synthesis, wash-down, mother-liquor recovery, and formulation, and the parameter ranges shift with the production campaign. The table below summarizes the design envelope a process engineer should bench-test against before specifying reactors.
| Parameter | Typical range | Design implication |
|---|---|---|
| Total phosphorus (TP) | 30–800 mg/L | Size chemical precipitation for peak, not average |
| Organophosphorus (OP) fraction | 40–70% of TP | Pre-oxidation is mandatory, not optional |
| COD | 5,000–35,000 mg/L | Drives Fenton H₂O₂ dose; threatens bio-P PAOs above ~10,000 mg/L |
| BOD/COD ratio | <0.25 (often 0.10–0.20) | Raw stream is not directly biotreatable |
| pH | 2–9 (synthesis-stage dependent) | Equalization and neutralization required ahead of biology |
| Salinity / TDS | 2,000–15,000 mg/L | High Cl⁻ corrodes stainless; FRP or lined concrete preferred |
| NH₄⁺-N | 20–400 mg/L | Enables MAP crystallization when molar NH₄⁺:PO₄ approaches 1:1 |
| Toxicity (microbial inhibition) | High — solvent, phenol, pesticide residues | Pre-oxidation or sidestream treatment required before EBPR |
Campaign-day spikes are the failure mode most often missed. Organophosphorus synthesis batches release concentrated esterified P during product-changeover; the 30–800 mg/L TP range above is the daily average, but a 6-hour campaign slug can hit 1,200 mg/L. Equalization basins sized for at least 24 hours of hydraulic retention time (HRT) smooth those peaks and keep downstream chemistry in its operating window.
Co-contaminants also reshape the design. High Ca²⁺ from in-process lime use is an asset — it consumes PO₄³⁻ directly. High NH₄⁺ enables MAP (struvite) crystallization and turns a waste liability into a fertilizer sidestream. Surfactants from formulation, residual solvents, and chlorinated intermediates do the opposite: they inhibit PAOs and suppress biological luxury uptake, which is why the recommended flowsheet treats biology as a polishing step rather than a workhorse.
The mussel-shell adsorption study (Paradelo et al., Ecological Engineering, 2016) is useful here only as a mechanism benchmark — calcined shell followed Langmuir kinetics at 24 h and Freundlich at 72 h, with desorption below 4%. The adsorption capacity numbers (order-of-magnitude mg P per g shell) are research-stage and should not be used to size a full-scale adsorber for a 200 mg/L pesticide stream.
Pre-Oxidation: Breaking the Organophosphorus Ester Bond
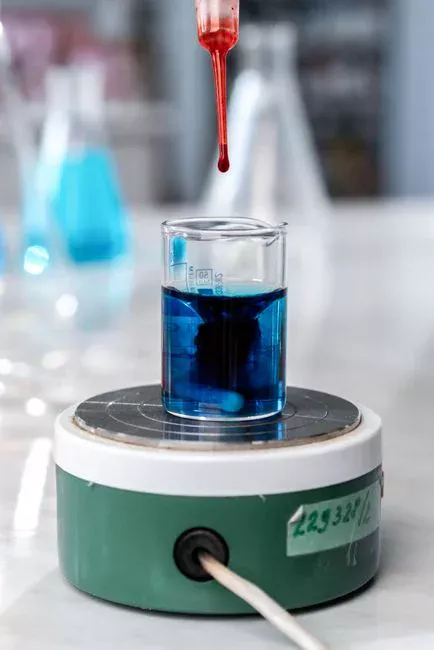
Pre-oxidation is the step that converts the 40–70% esterified P fraction into orthophosphate that downstream precipitation and biology can actually touch. Three technologies dominate; the choice is driven by influent COD, toxicity, and operating-cost tolerance.
| Technology | Operating window | OP → PO₄³⁻ conversion | COD removal | Best-fit stream |
|---|---|---|---|---|
| Fenton (H₂O₂/Fe²⁺) | pH 3, 1.5–3.0× stoichiometric H₂O₂, HRT 60–120 min | 70–90% | 40–60% | COD >10,000 mg/L, variable matrix |
| Ozonation (O₃) | 2–6 g O₃/m³, HRT 30–60 min, O₃/TP molar ratio ≥4 | >85% | 20–35% | Low-COD polishing, no-sludge requirement |
| SCWO | 400–600 °C, 25 MPa, 30–60 s residence | >99% | >95% | High-toxicity streams where biology is blocked |
Fenton is the workhorse for agrochemical streams because the same Fe²⁺/H₂O₂ pair that cracks the P–O ester bond also strips 40–60% of the COD as CO₂, reducing the load on downstream biology. The penalty is acid consumption (sulfuric acid to drop pH to 3, then NaOH or lime to neutralise back to 7–8), iron sludge generation (~0.5–0.8 kg Fe(OH)₃ per kg H₂O₂ dosed), and reagent handling — a strong argument for a disciplined chemical dosing system maintenance protocol on the H₂O₂ and FeSO₄ skids.
Ozonation is cleaner — no sludge, low footprint — but the OP/TP molar ratio and the high ozone demand of phenolic intermediates make it uneconomic on raw pesticide effluent. Its real role is as a final polish ahead of MAP or biological luxury uptake, particularly when residual OP is still 5–10 mg/L after Fenton.
Supercritical water oxidation (SCWO) is the only single-step option that destroys both OP and COD simultaneously at >99% efficiency, and the Docin Chinese-language review of organophosphorus pesticide treatment identifies SCWO as a developing route for high-toxicity concentrates. The capital cost and the 25 MPa pressure rating limit it to centralized hazardous-waste facilities rather than in-plant units.
Chemical Precipitation: Lime, Alum, and Magnesia Routes
After pre-oxidation, the bulk of the orthophosphate pool is removed by chemical precipitation. The choice of reagent is set by target effluent TP, downstream compatibility, and whether the plant wants to recover P as fertilizer or dispose of it as sludge.
| Reagent | Dose | pH window | HRT | Effluent TP | Sludge yield | Cost band (USD/m³) |
|---|---|---|---|---|---|---|
| Lime Ca(OH)₂ | 1.2–1.5× stoichiometric | 9.5–11 | 30–60 min | 5–15 mg/L | 3–5 kg DS per kg P removed | 0.18–0.34 |
| Alum Al₂(SO₄)₃ | 1.0–1.4× stoichiometric Al | 6.5–7.2 | 20–45 min | 1–5 mg/L | 4–6 kg DS per kg P | 0.30–0.55 |
| Magnesia (MgCl₂ or MgO) | 1.0–1.3× stoichiometric Mg, NH₄⁺:PO₄ ≈ 1:1 | 8.5–9.5 | 30–90 min | 1–3 mg/L | Recovered as MAP, 0.4–0.7 t MAP per t P | 0.40–0.70 (offset by fertilizer credit) |
The 1996 Galarneau & Gehr mechanism paper in Water Research is still the right citation to defend an alum dose to a sceptical reviewer: orthophosphate is not removed as pure AlPO₄ but as a mixed aluminum hydroxide-phosphate precipitate at pH 3.6, with P partitioning to the particulate fraction of the sludge. That is why alum dose is tuned to the Al(OH)₃ solubility envelope, not to a simple P:Al molar ratio, and why alum performance is so sensitive to pH swings in the influent.
Lime is the most robust option for variable pesticide streams. It tolerates pH 2–9 in the feed, drops TP to 5–15 mg/L, and the Ca²⁺ already in the matrix from in-process use reduces reagent demand. The downside is the high sludge volume (3–5 kg DS per kg P), which forces the design toward a PLC-controlled chemical dosing skid for lime handling and a downstream dewatering unit rather than a direct landfill disposal route.
Magnesia (MgCl₂ or MgO) only makes sense when the NH₄⁺:PO₄ molar ratio is already near 1:1, which is true for streams from glyphosate and certain carbamate syntheses. When the chemistry lines up, the P comes out as MgNH₄PO₄·6H₂O (MAP, struvite), a slow-release fertilizer with a real market — the Waste & Biomass Valorization thermodynamic modeling paper frames P recovery this way, noting that global phosphate rock reserves could be exhausted within the next 100 years (per 2019 review). The economic case is fertilizer-credit-driven: 0.4–0.7 t of MAP recovered per tonne of P removed offsets the higher reagent cost.
Biological Polishing: A²O, SBR, and MBR for Luxury Uptake
Biology in this flowsheet is a polisher, not a workhorse. After Fenton has converted the OP and lime has dropped the bulk orthophosphate, residual PO₄³⁻ in the 5–15 mg/L window is the right feed for enhanced biological phosphorus removal.
An A²O (anaerobic/anoxic/aerobic) train running anaerobic HRT 1–2 h, aerobic HRT 4–6 h, and SRT 15–25 days typically removes 70–90% of residual orthophosphate, pushing TP to under 1 mg/L on a well-settled feed. The SBR variant with an acetate co-substrate in the pulse-feed anaerobic phase releases 8–12 mg PO₄³⁻ per g VSS, then re-stores it in the aerobic phase to under 0.5 mg/L — useful when the upstream chemical stage leaves a tighter target and the plant wants biological luxury uptake to do the last 0.3 mg/L.
MBR couples activated sludge with a submerged 0.1–0.4 µm PVDF membrane, supports higher MLSS at 8,000–12,000 mg/L, and tightens the TP floor further. A well-designed MBR also retains PAO biomass that would otherwise wash out of a conventional clarifier at high rainfall or hydraulic surge — a frequent complaint at agrochemical sites where storm separation is imperfect.
The hard limit on biology is that it cannot touch un-hydrolyzed OP. If the upstream Fenton or ozone stage is under-dosed, residual esterified P passes through the A²O, MBR, or SBR unchanged, and the plant misses its discharge limit. This is why pre-oxidation is non-negotiable in the flowsheet, and why total nitrogen removal technologies in 2026 are typically specified together with P removal in the same train — the carbon and ammonia loads in pesticide effluent drive both unit operations.
Comparison Table: Choosing the Right P-Removal Train for Your Pesticide Plant
The matrix below is the single page to bring into a project review. It maps each unit operation to its design window, cost band, and the pesticide stream it actually fits.
| Stage | Influent TP window | Effluent TP | CAPEX (USD/m³·d) | OPEX (USD/m³) | Sludge yield | Best-fit stream |
|---|---|---|---|---|---|---|
| Pre-oxidation (Fenton) | 30–800 mg/L | 20–200 mg/L (as PO₄³⁻) | 80–180 | 0.60–1.40 | 0.5–0.8 kg Fe(OH)₃/kg H₂O₂ | High-COD, variable matrix |
| Lime precipitation | 10–200 mg/L | 5–15 mg/L | 60–140 | 0.18–0.34 | 3–5 kg DS/kg P | Roughing, cost-driven plants |
| Alum precipitation | 5–50 mg/L | 1–5 mg/L | 70–150 | 0.30–0.55 | 4–6 kg DS/kg P | Tight effluent, low pH variability |
| Magnesium / MAP | 5–60 mg/L + NH₄⁺:PO₄ ≈ 1:1 | 1–3 mg/L + fertilizer recovery | 90–200 | 0.40–0.70 (credit) | Recovered as MAP | P-recovery-driven projects |
| A²O / SBR / MBR | 1–15 mg/L | 0.3–1.0 mg/L | 120–280 | 0.15–0.35 | 0.2–0.4 kg DS/kg P | Polishing after chemistry |
| Adsorption (calcined mussel shell or similar) | 0.5–10 mg/L | 0.1–0.5 mg/L | 50–120 (research-stage) | 0.20–0.50 | Spent adsorbent regeneration | Tertiary polish, R&D scope |
Hybrid trains — Fenton + lime + A²O + MAP on a sidestream — consistently outperform any single-stage option on both compliance and total cost in 2026 Chinese and EU case studies. The CAPEX delta versus a single chemical stage is recovered inside 3–5 years through lower reagent consumption, smaller sludge volumes, and the MAP fertilizer credit. The article on domestic sewage phosphorus removal process covers the lower-strength analogue; the pesticide variant differs mainly in the pre-oxidation step and the higher reagent dose.
Recommended 2026 Hybrid Flowsheet and Compliance Check
The end-to-end train below is what I would specify for a 5,000–20,000 m³/d agrochemical plant discharging to surface water in 2026, with influent TP of 200 mg/L, COD 15,000 mg/L, and NH₄⁺-N 200 mg/L.
Equalization (24 h HRT) → Fenton pre-oxidation (pH 3, 1.8× stoichiometric H₂O₂, 90 min) → neutralization to pH 7–8 → DAF for colloidal and precipitated P solids (see DAF for colloidal and precipitated P solids) → lime precipitation (pH 10, 45 min) → lamella clarifier for lime sludge and MAP harvest (see lamella clarifier for lime sludge and MAP harvest) → A²O polishing (anaerobic 1.5 h, aerobic 5 h, SRT 20 d) → MAP crystallization on the A²O dewatering sidestream (NH₄⁺:PO₄ tuned to 1:1 with MgCl₂) → filter press for P-rich chemical sludge (see filter press for P-rich chemical sludge) → sand filtration → ClO₂ disinfection for the final polished effluent (see ClO₂ disinfection for the final polished effluent).
Staged TP removal walks as follows: 200 mg/L raw → 30 mg/L post-Fenton → 8 mg/L post-lime → 0.6 mg/L post-A²O → <0.5 mg/L final effluent. Each stage is mappable to a compliance threshold:
- China GB 21523 (2024 revision, in force): TP ≤0.5 mg/L for surface-discharging agrochemical plants — met at the final polish.
- EU BAT-AEL for agrochemical discharges (2024 BREF update): TP ≤2 mg/L — met post-A²O, with the post-MAP stage providing 50% safety margin.
- US EPA pesticide ELG (40 CFR §455): process wastewater TP limits vary by subcategory but generally fall in the 0.5–2.0 mg/L band — met at the same final polish point.
For permit submission, instrument the Fenton, lime, and MAP reactors with continuous orthophosphate analyzers on the post-precipitation and post-A²O streams. Online P measurement cuts the lag between an upstream upset and a discharge excursion from 24 h (grab sample) to under 15 min, which is what regulators will ask for in a 2026 permit review.
Frequently Asked Questions
What is the typical total phosphorus concentration in pesticide manufacturing wastewater? TP usually falls in the 30–800 mg/L range, with 40–70% present as organophosphorus esters (parathion, methamidophos, glyphosate intermediates), and COD of 5,000–35,000 mg/L. Design for campaign-day peaks, not annual averages.
Can biological treatment alone remove phosphorus from organophosphorus pesticide wastewater? No. Un-hydrolyzed organophosphorus esters are not bioavailable to PAOs and pass through an A²O, SBR, or MBR unchanged. Fenton or ozone pre-oxidation is required first to convert OP to PO₄³⁻, and chemical precipitation is required to drop the bulk load before biology is viable.
What is the 2026 Chinese discharge limit for TP in pesticide effluent? GB 21523 sets TP ≤0.5 mg/L for surface-discharging agrochemical plants, with the 2024 revision tightening monitoring requirements for organophosphorus production lines specifically.
Is MAP crystallization economically viable for pesticide wastewater? Yes, when the NH₄⁺:PO₄ molar ratio is near 1:1 — typically on a sidestream from the A²O dewatering centrate rather than the main flow. Recovery is 85–95% as MgNH₄PO₄·6H₂O, at 0.4–0.7 t of MAP per tonne of P removed. The fertilizer credit offsets the higher reagent cost versus lime.
Which precipitation reagent gives the lowest effluent TP — lime, alum, or magnesia? Alum and magnesia both reach 1–3 mg/L on a stable feed. Lime typically stops at 5–15 mg/L but is the cheapest and most robust option on variable pesticide streams, which is why the recommended flowsheet uses lime for the bulk stage and reserves alum or MAP for the polish.