Why Fluoride Discharge Limits Vary So Widely in 2026
Fluoride effluent limits in 2026 range from 4 mg/L (US EPA direct discharge to freshwater) to 50 mg/L (German inland discharges under certain receiving-water conditions), with China's GB 8978-1996 Class I/II at 10 mg/L, typical EU member-state practice at 15 mg/L, and the WHO drinking water guideline at 1.5 mg/L. The 12.5× spread is not an inconsistency — it is the predictable outcome of how each jurisdiction weighs receiving-water hardness, dilution capacity, aquatic species sensitivity, and end-use of the receiving body. A compliance engineer working in 2026 cannot engineer to "the fluoride limit"; they must engineer to a specific jurisdictional limit plus any local watershed overlay.
Fluoride is a non-conventional pollutant: its toxicity to fish and invertebrates is strongly modulated by water hardness (Ca²⁺ and Mg²⁺ antagonize F⁻ uptake), and at pH below 6.5 a significant fraction converts to the more toxic undissociated HF (pKa 3.17). Jurisdictions therefore set limits after local hydrogeochemistry, not against a single global toxicity number (per Damtie 2019, Chemosphere, citing EPA's 4 mg/L baseline). China codifies three classes in GB 8978-1996 — Class I/II at 10 mg/L F⁻ for sensitive receiving waters and new industrial projects, Class III at 20 mg/L for less sensitive receiving bodies — and Class I/II has become the de facto procurement specification for new builds even where local receiving water would permit Class III. The EU IPPC Directive (96/61/EC, still referenced in 2026 permit writing) leaves numeric values to member states; Germany issues permits between 5 and 50 mg/L depending on receiving-water flow and hardness, while France and the UK typically write 15 mg/L. In the United States, the EPA fluoride effluent guideline for direct discharge to freshwater sits at 4 mg/L, but the drinking water MCL — 2.0 mg/L, set under the 2011 HHS/EPA joint announcement and still in effect in 2026 — is the number that governs any plant whose effluent re-enters a potable system (per PA DEP, 2025-08). WHO's 1.5 mg/L drinking water guideline is the benchmark for industrial sites that blend treated effluent into reuse for human contact.
Global Fluoride Discharge Standard Matrix (2026 Reference Table)
The matrix below consolidates the major 2026 limits a compliance engineer encounters when siting or permitting a fluoride-generating facility. Local authorities may impose stricter limits based on effluent quality or watershed sensitivity (Pennsylvania inland waters, for example, are commonly written 2–4 mg/L at the permit level even though the EPA baseline is 4 mg/L).
| Jurisdiction | Standard / Regulation | F⁻ Limit (mg/L) | Application / Receiving Body | Year Confirmed |
|---|---|---|---|---|
| China | GB 8978-1996, Class I/II | 10 | Direct discharge to municipal sewer or surface water (sensitive) | 1996, in force 2026 |
| China | GB 8978-1996, Class III | 20 | Less sensitive receiving water | 1996, in force 2026 |
| United States | EPA fluoride effluent guideline | 4 | Direct discharge to freshwater | Per 2011 HHS/EPA joint statement |
| United States | EPA Drinking Water MCL | 2.0 | Potable water (relevant if effluent re-enters supply) | 2025-08, still in effect |
| European Union | IPPC Directive 96/61/EC, member-state permits | 5–50 | Germany 5–50; France/UK typically 15 | 1998, applied 2026 |
| India | CPCB Environment (Protection) Rules, Schedule VI | 5 | Inland surface water | 2024 amendment, in force 2026 |
| WHO | Drinking Water Guideline Value | 1.5 | Drinking water (reuse or potable blending) | 2017, referenced 2026 |
| Saudi Arabia | PME (Presidency of Meteorology and Environment) | 5 | Industrial discharge to marine and inland | 2023 update, in force 2026 |
Industries Generating High-Fluoride Wastewater
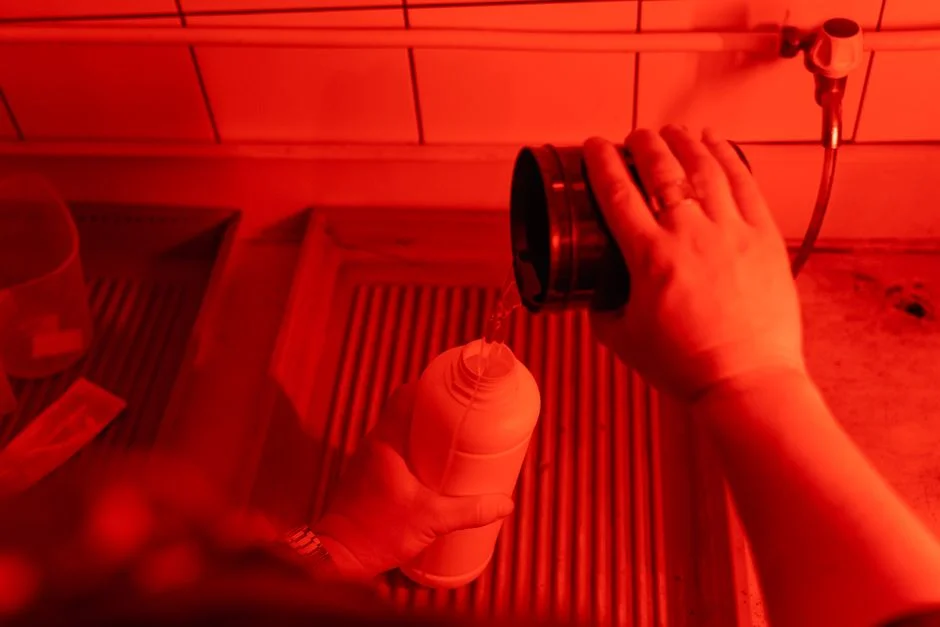
Four industrial sectors account for the bulk of the world's fluoride discharge load. Identifying which sector a facility sits in is the first step in selecting a treatment train because influent F⁻ concentration, co-contaminants, and flow pattern vary by an order of magnitude between them (per Horiba industrial wastewater application note, 2025-11).
Aluminum smelting and aluminum fluoride production generate wastewater with influent F⁻ of 50–500 mg/L, high TSS from spent pot linings, and elevated dissolved Al³⁺ that interferes with downstream precipitation if not managed. Semiconductor manufacturing — specifically HF etching of silicon wafers — produces spike flows at F⁻ 100–1,000 mg/L mixed with IPA, TMAH, and other process chemicals; treatment trains must neutralize free HF first or downstream concrete and steel corrode rapidly. Glass manufacturing and ceramic frit production discharge F⁻ at 20–200 mg/L, with a significant fraction bound in particulate that reports to primary clarification; a deeper treatment case is documented in the silicon wafer wastewater recycling engineering guide. Fertilizer production from phosphate rock is the most extreme: raw wastewater F⁻ runs 1,000–10,000 mg/L, with HF gas scrubber liquor adding a separate low-pH stream that must be segregated and neutralized before it reaches the main treatment train. A facility's inlet F⁻ is the single strongest driver of capital cost; below 50 mg/L, precipitation alone may suffice, while above 1,000 mg/L the train almost always needs a membrane or ZLD step.
Fluoride Chemistry: Why F⁻ Is Harder to Remove Than Heavy Metals
F⁻ is a monovalent anion with no simple hydroxide precipitate, which is the first conceptual gap for engineers accustomed to designing chromium or nickel removal trains. Cr(OH)₃ and Ni(OH)₂ form at controlled pH and report to sludge; F⁻ does not. The workhorse reaction is calcium fluoride precipitation: Ca²⁺ + 2F⁻ → CaF₂(s), with Ksp ≈ 3.9 × 10⁻¹¹. At stoichiometric calcium dose and pH 7–9, the theoretical residual sits at 8–10 mg/L F⁻; in practice, coprecipitation with CaCl₂ and lime at 100–110% stoichiometric dose and seeding with recycled CaF₂ nuclei pushes plant residuals to 5–8 mg/L (HydropureWater field data, 2026).
pH control is the operationally critical variable. Below pH 6, a growing fraction of F⁻ converts to HF and HF₂⁻, both of which stay in solution and report directly to the effluent. Above pH 10, CaF₂ re-dissolves as the hydroxide complexes calcium, releasing F⁻ back into solution. The operating window is therefore narrow — pH 7 to 9 — and a 0.5-unit excursion in either direction will double the effluent F⁻ within one reactor residence time. The other mechanism that makes fluoride trains longer than heavy-metal trains is co-removal: once precipitation has done its bulk work, adding Al₂(SO₄)₃ or FeCl₃ at 50–150 mg/L forms an amorphous metal hydroxide floc that adsorbs the residual F⁻, dropping effluent by another 2–4 mg/L in a single polish step without additional sludge chemistry.
Fluoride Removal Technologies: 2026 Comparison
Five unit operations cover the design space from primary reduction to zero liquid discharge. The selection rule is influent concentration first, then target limit, then reuse or discharge intent. Cost figures are order-of-magnitude USD per cubic meter of treated water, 2026 basis (HydropureWater field data, 2026).
| Technology | Influent Range (mg/L) | Effluent Achievable (mg/L) | Sludge / Reagent Intensity | CAPEX (USD/m³·d) | OPEX (USD/m³) | Best Use Case |
|---|---|---|---|---|---|---|
| Chemical precipitation (CaCl₂ + lime) | 50–10,000 | 8–15 | High — ~6 kg dry CaF₂ sludge per kg F⁻ removed | 150–300 | 0.40–0.80 | Primary reduction for any high-F⁻ stream |
| Coagulation with Al₂(SO₄)₃ or PAC | 5–50 | 2–5 | Low — metal hydroxide floc, ~0.5 kg per m³ | 80–150 | 0.20–0.35 | Polish stage after precipitation |
| Activated alumina adsorption | 5–20 | 0.5–2 | Regeneration NaOH required; bed life 2–5 years | 200–400 | 0.30–0.60 | Low-flow reuse polishing to drinking-water quality |
| Reverse osmosis | 5–200 | <1 | Brine 50–60% of feed; no chemical sludge | 400–700 | 0.50–1.20 | High-purity water reuse; an industrial RO system for fluoride polishing is the standard 2026 specification |
| Membrane ZLD (per Damtie 2019, Chemosphere) | 5–500 | Near-zero liquid discharge | Crystallizer solids; thermal brine concentrator | 1,500–3,000 | 1.50–3.00 | Water-scarce or zero-discharge sites; fertilizer plants in arid regions |
Recommended Treatment Trains by Industry
The technology comparison maps directly onto four industry-specific trains. Each train below is a defensible 2026 specification a compliance engineer can hand to procurement or an EPC.
Aluminum smelter. Equalization (24 h HRT to smooth pot-line surges) → CaCl₂ + lime precipitation in a lamella clarifier for CaF₂ precipitation (pH 8.0–8.5, 100–110% stoichiometric dose) → sand/multi-media filtration to capture carryover floc → RO if reuse is required, targeting <2 mg/L F⁻ in the permeate via an industrial RO system for fluoride polishing. Reject brine returns to the clarifier for further CaF₂ recovery.
Semiconductor fab. HF neutralization with NaOH or Ca(OH)₂ in a dedicated acid-waste basin (pH 7–8) → DAF for semiconductor HF neutralization solids to remove precipitated metals and TMAH floc → CaF₂ precipitation in a clarifier → two-pass RO for reuse-grade water → mixed-bed DI polish for ultra-pure water loops. The DAF step is non-optional: HF neutralization produces a fine floc that settles poorly and will blind an RO pretreatment cartridge in hours if not removed upstream.
Glass / ceramic plant. Grit removal and cooling equalization → CaCl₂ precipitation in a lamella clarifier (pH 8.0–8.5) → sludge dewatering with a filter press for CaF₂ sludge dewatering to a 35–40% dry cake for landfill → supernatant RO only if the plant operates a water-reuse program; otherwise discharge at 8–12 mg/L F⁻ is typically compliant with the 10 mg/L Class I/II ceiling under GB 8978-1996.
Fertilizer plant (phosphate rock processing). Segregate HF scrubber liquor and neutralize in a dedicated reactor (Ca(OH)₂ to pH 8) → primary CaF₂ precipitation targeting residual 50–80 mg/L → secondary Al-coagulation polish to 5–10 mg/L → brine management via membrane ZLD or thermal crystallizer. The ZLD step is the differentiator: phosphate fertilizer plants in water-scarce regions (Middle East, inland China, North Africa) cannot discharge brine and must recover saleable NaF or CaF₂ byproduct. For a parallel reference on heavy-metal limits, see the chromium discharge standard 2026 reference, and for ammonia-nitrogen co-management in fertilizer wastewater, the ammonia nitrogen discharge limit South Africa guide.
Monitoring, Sludge Handling, and 2026 Compliance Steps
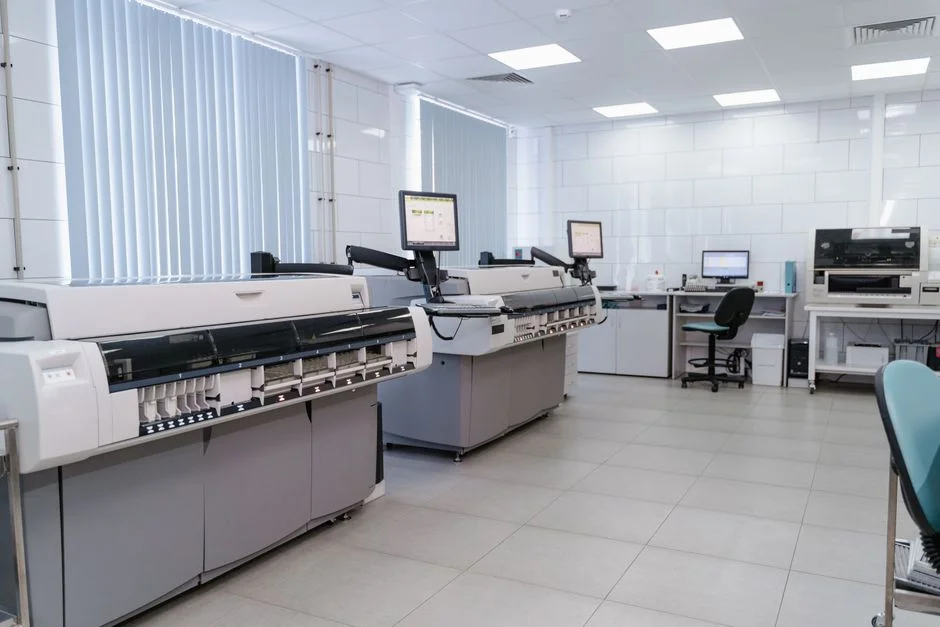
On-line fluoride monitoring is now standard for any plant discharging more than 5 m³/d of fluoride-bearing effluent. Ion-selective electrode (ISE) analyzers such as the Horiba LAQUAtwin F-11 cover 0.1–10,000 mg/L with sub-30-second response, allowing closed-loop control of the CaCl₂ dose pump (per Horiba application note, 2025-11). An automatic dosing for lime and CaCl₂ package linked to the ISE signal holds residual F⁻ within ±1 mg/L of setpoint and cuts lime consumption 8–12% versus manual control (HydropureWater field data, 2026).
Calcium fluoride sludge is classified as non-hazardous in most jurisdictions — US EPA RCRA, EU Waste Framework Directive 2008/98/EC, and China GB 34330 — but it is high-volume: roughly 6 kg of dry CaF₂ per kg of F⁻ removed at stoichiometric dose. Dewatering with a filter press to 35–40% dry solids is standard; landfill disposal is the dominant route, with limited agricultural reuse as a soil amendment in regions with fluorosis-deficient soils. The three compliance steps for 2026 are: (1) confirm jurisdiction and applicable limit using the global matrix, including any watershed-specific overlay such as Pennsylvania's tighter inland-waters permit values; (2) verify effluent with weekly laboratory analysis (SPADNS or ion chromatography per Standard Methods 4500-F⁻) plus continuous on-line ISE at the discharge point; (3) document dose rates, residual F⁻, and sludge volume in the annual discharge report required under each jurisdiction's permit — China requires monthly records under GB 8978-1996 enforcement, the US NPDES program requires DMR submission, and the EU IED requires annual environmental reporting.
Frequently Asked Questions
What is the China fluoride discharge standard for industrial wastewater in 2026?
GB 8978-1996 sets Class I and Class II at 10 mg/L F⁻ and Class III at 20 mg/L. Class I/II is the de facto standard for new industrial projects, particularly those discharging to municipal sewers or sensitive receiving waters.
What is the US EPA fluoride effluent limit?
4 mg/L for direct discharge to freshwater under the EPA effluent guideline framework (per the 2011 HHS/EPA joint statement, still in effect 2026). The drinking water MCL is 2.0 mg/L — that number governs when treated effluent re-enters a potable supply, not direct industrial discharge.
Can calcium precipitation alone meet 10 mg/L F⁻?
Yes, at stoichiometric CaCl₂ + lime dose with pH held at 7–9 and recycled CaF₂ seed; residuals of 5–8 mg/L are typical (HydropureWater field data, 2026). For sites with influent variability above 500 mg/L, an Al- or Fe-coagulation polish is recommended to handle the 2–4 mg/L swing during upset conditions.
Which fluoride removal technology is best for semiconductor wastewater?
The standard 2026 train is HF neutralization → DAF → CaF₂ precipitation → two-pass RO → DI polish. RO alone cannot handle the suspended solids and organics from HF etching; DAF must precede precipitation to protect clarifier and RO pretreatment.
Is fluoride sludge hazardous?
CaF₂ sludge from industrial wastewater treatment is classified non-hazardous in the US (RCRA), EU (WFD 2008/98/EC), and China (GB 34330), but it is high-volume — approximately 6 kg dry solids per kg F⁻ removed at stoichiometric dose. Standard practice is filter-press dewatering to 35–40% dry solids followed by secure landfill disposal; reuse as agricultural soil amendment is permitted only in regions with documented fluorosis-deficient soils and with local regulator approval.