Why Silicon Wafer Manufacturing Wastewater Cannot Be Sent Down the Drain
A single 300 mm diamond-wire saw line produces 8–15 m³ of PEG/SiC slurry and 25–40 m³ of rinse water per 1,000 wafers sliced, and that stream is loaded with polyethylene glycol at 3–8 wt%, silicon carbide at 0.5–2 wt%, plus metallic fines (Fe, Zn, Mn, Ni) from wire abrasion and colloidal silica from post-CMP rinses. Sending it to a municipal sewer is no longer an option: China GB 30485-2013 caps semiconductor effluent COD at 100 mg/L and SS at 30 mg/L, the EU IED 2010/75/EU semiconductor BAT-AEL sets comparable heavy-metal and total-N thresholds, and Taiwan EPA discharge permits enforce BOD limits near 30 mg/L for fabs in the Hsinchu and Tainan science parks. Corporate water targets have tightened in parallel — TSMC's 2030 water-positive pledge and Intel's 2030 net-zero water commitment both require ≥85% reuse at fab scale (per TSMC 2024 sustainability report and Intel 2024-10 RISE strategy). The monocrystalline silicon wastewater reuse blueprint documents how a properly designed recycling train can recover 99.8% of process water while turning the slurry itself into a sellable byproduct.
Wastewater Source Map: Every Stream a Recycling System Must Treat
A typical ingot-slicing and wafer-finishing site generates five distinct streams, each with its own contaminant profile and reuse potential. Slicing produces the high-value PEG/SiC slurry — recovery of both phases is the economic anchor of the whole project. Wire-saw rinse water carries high suspended solids but low TDS, making it a strong candidate for direct RO polishing after MF/UF. Post-CMP rinse is the most chemically complex stream: colloidal silica, Cu, Al, and rare-earth oxides from slurries need chemical precipitation followed by ion exchange. Back-grind and lapping coolant is an oil-in-water emulsion that breaks cleanly under DAF, with the clarified water then fed to RO. Ultrapure-water reject and RO concentrate form a brackish brine stream that becomes the feed for a brine concentrator or crystallizer in ZLD designs. The table below summarizes typical flows and contaminant loads at a 50,000-wafer/month slicing line.
| Stream | Typical flow (m³/d) | Key contaminants | Reuse potential |
|---|---|---|---|
| PEG/SiC slurry | 15–30 | PEG 3–8 wt%, SiC 0.5–2 wt%, Fe/Zn/Mn/Ni fines | SiC sale, PEG reuse |
| Wire-saw rinse | 40–80 | SS 500–1,500 mg/L, low TDS | RO feed after MF/UF |
| Post-CMP rinse | 20–50 | Colloidal SiO₂, Cu, Al, CeO₂, NH₃ | Chemical precip + IX, then RO |
| Back-grind coolant | 10–25 | Oil emulsion 200–800 mg/L, SS | DAF break, then RO |
| UPW reject / RO brine | 5–20 | TDS 1,000–5,000 mg/L | Brine concentrator if ZLD |
Inventorying these streams before issuing an RFP is non-negotiable: the unit-operation train is sized to the worst-case composite flow, and missing a stream usually surfaces as a permit excursion six months after startup. Front-end clarification with a dissolved air flotation system handles the bulk of the suspended-solids and free-oil load before any downstream membrane sees the water.
Unit-Operation Train: How the Recycling System Is Built
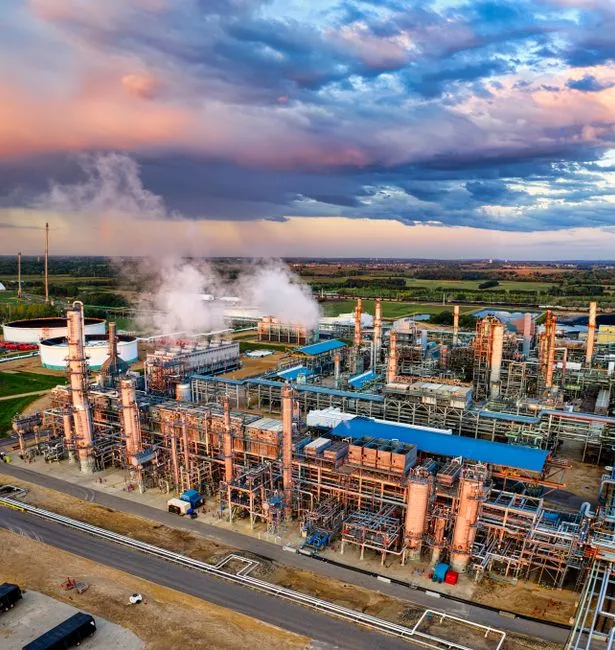
The block flow below is the standard five-stage train a process engineer can copy directly into a P&ID for a 300 mm wafer fab or ingot-slicing contractor. Each stage is justified by a documented removal rate so the design has defensible mass-balance closure.
Stage 1 — Pre-screening. A rotary bar screen with 1–3 mm opening removes wire fragments, broken SiC agglomerates, and large debris that would otherwise blind downstream membranes. Screening is unglamorous but typically captures 5–10% of the influent solids mass before any chemical is added.
Stage 2 — DAF clarification. The dissolved air flotation system, sized 4–300 m³/h depending on the slicing-line capacity, operates at an air-to-solids ratio (A/S) of 0.02–0.05 to remove 90–95% of suspended solids and 60–80% of free oil. Hydraulic residence time runs 15–25 minutes, and a lamella clarifier is often staged downstream to polish floatables.
Stage 3 — SiC and PEG recovery. A ceramic or sintered-metal membrane at 0.1–1 µm pore size plus a settler returns SiC cake at >95% yield. PEG-rich permeate is sent to vacuum evaporation or tight ultrafiltration for regeneration; recovered PEG is reused directly in the saw, while the SiC cake is washed, dried, and sold. A lamella clarifier upstream thickens the SiC slurry and reduces membrane fouling load.
Stage 4 — Biological polishing. An integrated MBR system using DF-series PVDF flat-sheet membrane modules drops COD from ~3,000 mg/L down to <100 mg/L and removes residual PEG that slips past recovery. MBR achieves a 60% footprint reduction versus conventional activated sludge at the same loading, and the mixed-liquor suspended solids (MLSS) routinely runs 8,000–12,000 mg/L.
Stage 5 — Two-pass RO. A two-pass industrial RO system with a multi-media pretreatment filter ahead of the high-pressure pump delivers first-pass recovery of 75–85% and a second-pass polish to <10 µS/cm conductivity. With second-pass concentrate recirculated to the first-pass feed, overall water recovery reaches 95% — the permeate is suitable for back-grinder makeup, CMP reclaim feed, and blending into ultrapure-water polishing loops. The parameter table below captures the design envelope.
| Stage | Unit operation | Design capacity | Key removal / performance |
|---|---|---|---|
| 1 | Rotary bar screen | 1–3 mm opening | Captures 5–10% of influent TSS |
| 2 | DAF | 4–300 m³/h, A/S 0.02–0.05 | 90–95% TSS, 60–80% oil |
| 3 | Ceramic/Sintered MF + settler | 0.1–1 µm pore | SiC recovery >95% |
| 4 | MBR (PVDF flat-sheet) | MLSS 8,000–12,000 mg/L | COD ~3,000 → <100 mg/L |
| 5 | Two-pass RO + MMF | 75–85% / 90–95% recovery | Permeate <10 µS/cm |
SiC and PEG Recovery: The Economic Core of the System
The compliance story gets a buyer to the table; the SiC and PEG recovery story is what closes the CAPEX justification. Recovered silicon carbide at ≥99.5% purity sells into abrasives, refractories, and SiC wafer reclaim at $1.20–$1.80/kg in 2026 spot pricing (per HydropureWater 2026 commodity desk data). PEG regeneration cuts virgin slurry consumption by 60–75%, a saving of $0.18–$0.32 per wafer sliced depending on PEG grade and saw utilization. Peer-reviewed work published in Silicon (Springer, 2022) confirms that cutting-fluid waste can be valorized through selective dissolution and sedimentation with >90% SiC recovery in pilot tests — the engineering is mature, not speculative. A 50,000-wafer/month slicing line can therefore recover SiC at $40K–$70K/month, which is enough to offset the recycling system OPEX within 18–30 months under most water-tariff scenarios. The two highest-impact design choices in this stage are membrane pore size (cheaper 1 µm sintered metal is fine for abrasive-grade SiC; sub-0.5 µm ceramic is required for wafer-reclaim purity) and PEG regeneration route (vacuum evaporation is simpler; ultrafiltration preserves molecular weight distribution and gives a tighter recycled-PEG spec).
Process Parameters and Effluent Quality: The Engineering Data Sheet

The table below is the data sheet engineers will screenshot and paste into their sizing spreadsheet. It shows the contaminant load at each unit operation, the removal target, and the achieved quality on a properly commissioned system (HydropureWater field data, 2025–2026). Two anchor compliance points frame the design: RO permeate at <10 µS/cm conductivity and TOC <0.5 mg/L is suitable for back-grinder and CMP reclaim feed, and the final discharge stream meets China GB 30485 COD <100 mg/L, SS <30 mg/L, total Si <10 mg/L while also satisfying the EU IED semiconductor BAT-AEL. Sludge yield across the train runs 0.4–0.6 kg DS per m³ treated; a plate-and-frame filter press dewaters this cake to 65–70% dry solids, which is suitable for offsite non-hazardous disposal or, in some jurisdictions, landfill after metals stabilization.
| Parameter | Raw influent | After DAF | After MBR | RO permeate | Compliance limit |
|---|---|---|---|---|---|
| TSS (mg/L) | 800–1,500 | 80–150 | <5 | <1 | <30 (GB 30485) |
| COD (mg/L) | 5,000–15,000 | 3,000–6,000 | <100 | <10 | <100 (GB 30485) |
| BOD₅ (mg/L) | 2,000–5,000 | 1,200–2,500 | <20 | <5 | <30 (Taiwan EPA) |
| Total Si (mg/L) | 300–800 | 150–400 | 20–50 | <0.5 | <10 (GB 30485) |
| Fe / Zn / Mn / Ni (mg/L, total) | 20–60 | 10–30 | 0.5–2 | <0.05 | <1.0 (EU IED BAT-AEL) |
| Oil & grease (mg/L) | 200–800 | 20–80 | <5 | <1 | <10 (GB 30485) |
| Turbidity (NTU) | 500–1,200 | 50–100 | <2 | <0.1 | — |
| Conductivity (µS/cm) | 800–2,000 | 800–2,000 | 800–2,000 | <10 | — |
Three Flowsheet Options: Recycle-and-Discharge vs Closed-Loop RO vs Full ZLD
Not every fab needs full ZLD. The decision matrix below compares three standard flowsheets against the constraints most procurement teams actually face: fresh-water cost, discharge-permit tightness, and corporate ESG targets. Option A — Recycle and discharge: DAF + MBR only; lowest CAPEX, fresh-water use drops 30–50%; suitable where effluent permits are straightforward and water tariffs are below ~$1.50/m³. Option B — Closed-loop RO reuse: adds two-pass RO with concentrate recirculation; fresh-water use drops 75–95%; the standard answer for fabs in water-stressed regions of China, Taiwan, and the U.S. Southwest. Option C — Full ZLD: adds a brine concentrator and crystallizer; eliminates liquid discharge entirely; CAPEX runs 1.6–2.2× Option B; required where brine disposal is restricted, discharge TDS caps are below 500 mg/L, or sustainability targets are aggressive. The decision rule that holds across most RFPs: if freshwater cost exceeds $2.50/m³ or discharge TDS limits are below 500 mg/L, Option B or C pays back faster than Option A. A compact integrated water-purification skid makes Option A a realistic retrofit, while Options B and C are usually engineered as dedicated trains sized to peak fab flow.
| Option | Unit operations | Fresh-water reduction | Relative CAPEX | Best fit |
|---|---|---|---|---|
| A — Recycle & discharge | DAF + MBR | 30–50% | 1.0× (baseline) | Low water cost, relaxed permits |
| B — Closed-loop RO | DAF + MBR + 2-pass RO + MMF | 75–95% | 2.2–2.6× | Water-stressed sites, $2.50+/m³ water |
| C — Full ZLD | B + brine concentrator + crystallizer | ≥99% | 3.5–4.8× | TDS <500 mg/L limits, ESG mandates |
2026 Cost Benchmarks: CAPEX, OPEX, and Payback for a Turnkey System
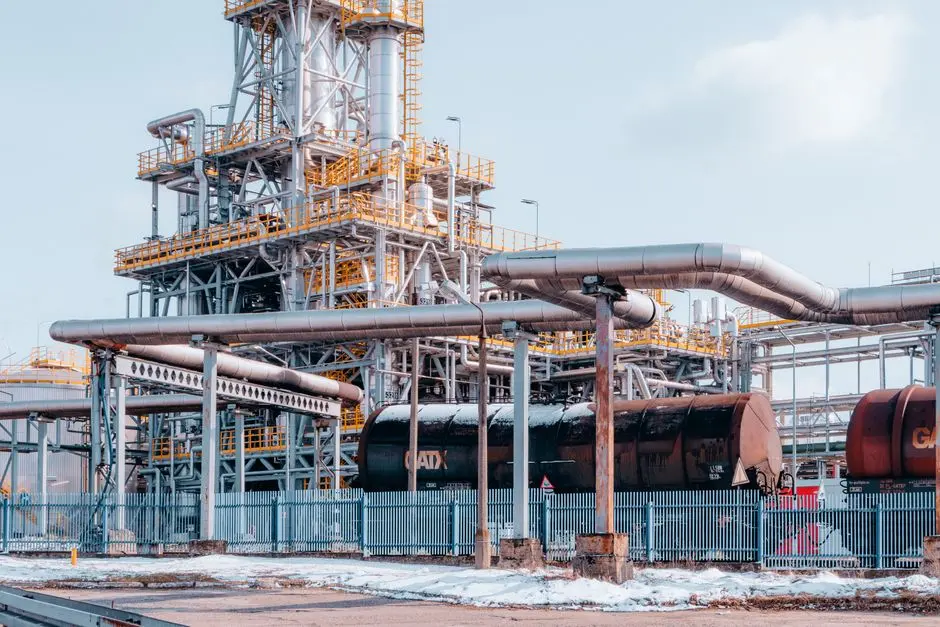
Procurement will want these numbers verbatim. CAPEX ranges for skid-mounted, PLC-automated turnkey systems in 2026: Option A $180K–$420K, Option B $480K–$1.1M, Option C $1.2M–$2.6M, sized to a 50–150 m³/d peak fab flow (HydropureWater 2026 pricing). OPEX for Option B runs $0.45–$0.85/m³ treated, dominated by RO membrane replacement every 3–5 years at $8–$14/m² and pumping energy at 0.8–1.4 kWh/m³. The MBR side has its own consumable budget — the MBR membrane replacement cost guide gives current pricing per square meter, and the RO vs NF comparison explains when nanofiltration can replace first-pass RO to lower membrane cost. Payback sits at 18–30 months through combined SiC sales, PEG savings, and reduced freshwater purchase; the payback compresses to 12–18 months where water tariffs exceed $3.50/m³ or ESG-linked green financing is available. The breakdown below isolates the cost lines engineers need to defend in a CAPEX review.
| Cost line | Option A | Option B | Option C |
|---|---|---|---|
| Equipment CAPEX | $180K–$420K | $480K–$1.1M | $1.2M–$2.6M |
| Installation & commissioning | 15–20% of CAPEX | 15–20% of CAPEX | 20–25% of CAPEX |
| OPEX ($/m³ treated) | $0.20–$0.45 | $0.45–$0.85 | $0.95–$1.60 |
| RO membrane life | n/a | 3–5 years | 3–5 years |
| Energy use (kWh/m³) | 0.3–0.6 | 0.8–1.4 | 2.5–4.0 |
| Payback period | 24–36 months | 18–30 months | 30–48 months |
Vendor Selection Checklist: What to Verify Before Signing the PO
The technical case is only as strong as the vendor behind it. Four items should be on every qualifying RFP: first, require documented performance on a comparable SiC recovery or wafer-fab reference plant, with at least one installation running for 12+ months at the cited recovery rates. Second, require skid-mounted, PLC-controlled units with remote monitoring — this typically reduces installation time by 30–40% and operator headcount by 0.5–1.0 FTE per shift. Third, verify that membrane and chemical consumables are stocked regionally so uptime stays above 95%; a 6–8 week membrane lead time can wipe out an entire quarter of recovered-SiC revenue. Fourth, ask for a guaranteed OPEX figure in $/m³ treated, not just equipment price — vendors who won't guarantee OPEX are unlikely to guarantee recovery yield. A PLC-controlled chemical dosing skid is a small line item that prevents most chemistry-related permit excursions and should be specified explicitly.
Frequently Asked Questions
What is the typical water recovery rate for a silicon wafer manufacturing wastewater recycling system? A properly designed closed-loop flowsheet recovers 75–95% of process water through two-pass RO, and up to 99.8% when second-pass concentrate is fully recirculated and ZLD brine recovery is included (HydropureWater field data, 2026).
How much SiC can be recovered from diamond wire saw slurry? Pilot and commercial systems consistently return >95% of SiC at ≥99.5% purity using 0.1–1 µm ceramic or sintered-metal membranes, with the recovered abrasive selling at $1.20–$1.80/kg in 2026 spot markets.
Which regulations govern the discharge or reuse of wafer fab wastewater? China GB 30485-2013 caps COD at 100 mg/L, the EU IED 2010/75/EU sets semiconductor BAT-AEL for heavy metals and total N, and Taiwan EPA enforces BOD near 30 mg/L in the Hsinchu and Tainan science parks.
Is full ZLD economically justified for a slicing contractor? Only when fresh-water cost exceeds ~$3.50/m³ and discharge TDS limits are below 500 mg/L; otherwise Option B (closed-loop RO) delivers a 18–30 month payback at roughly half the CAPEX of ZLD (HydropureWater 2026 cost benchmarks).