Why 2026 Market Trends Matter for Plant Capex
2026 market trends concentrate WWTP spend on MBR-RO trains, ZLD polish, and AI-ready controls. Tighter discharge limits, water-scarcity pricing above about USD 2/m³, and ESG audit demands now align. Buyers should specify modular skids with online analyzers, not timer-only concrete plants that fail the first utility review.
Adjacent equipment spend remains the cleanest WWTP capex proxy. Data Bridge projects the industrial valves market at USD 94.52B by 2026, rising from USD 70.25B in 2018 at a 3.78% CAGR (Data Bridge industrial valves report, 2019–2026 forecast). That baseline covers pumps, valves, tanks, and controls every plant still buys. Real growth sits in membranes, ZLD skids, and digital controls stacked on top.
Digital spend bends the curve harder. The AI-in-wastewater segment is forecast to reach USD 11.5B by 2030 at a 22.4% CAGR (per the AI in wastewater treatment forecast to 2030). That pace is roughly six times the underlying equipment market. For a 2026 buyer the design rule is clear: specify modular, digital-ready skids with PLC and analyzer inputs.
The pollutant envelope has widened too. Per Enaime et al. (2020) and Saleh et al. (2020), industrial streams now carry heavy metals, phenols, toxic organics, cyanide, nitrogen, phosphorus, suspended insoluble solids, pesticide residues, and pharmaceutical actives. That mix rules out single-unit biological treatment on most sites. It forces at least an MBR-RO pairing, or full ZLD where aquifers are already stressed. Plants comparing regional CAPEX models can also review the Puebla wastewater treatment plant cost breakdown for a concrete OPEX/CAPEX reference.
Technology Trend #1 — MBR and Membrane Bioreactors Become the Default
An MBR couples a suspended-growth activated-sludge basin with submerged microfiltration or ultrafiltration modules. Typical elements are 0.1 μm PVDF flat-sheet or hollow-fibre membranes. Solids retention time and hydraulic retention time are therefore decoupled. The operational payoff is concrete: a 60% footprint reduction versus conventional activated sludge of equal treatment capacity. Effluent TSS stays consistently below 1 μm, so the stream can feed a downstream RO unit without intermediate clarification. That second point makes MBR the de facto front end of any 2026 reuse train.
Membrane fouling remains the dominant risk. Flux decline, trans-membrane pressure creep, and chemical-cleaning frequency drive OPEX and membrane-replacement cost. Most plants we size for industrial reuse run aeration and wastage from online ammonia-nitrogen and turbidity analyzers rather than timer-based controls. Per the MBR market growth forecast to 2030, falling unit cost and broader vendor choice through 2026 raise Q1 negotiating leverage over Q4 buys.
For a plant manager comparing MBR against conventional ASP, three numbers decide the case. Footprint available comes first. Effluent TSS target comes next — anything below 10 mg/L favours MBR. Whether the downstream process needs RO-quality feed is the third. If that third answer is yes, MBR is no longer optional. Site-specific ASEAN scopes often mirror the approach used in the Chonburi 2026 engineering specs and cost models.
Technology Trend #2 — Reverse Osmosis, ZLD, and the Rise of Water Reuse
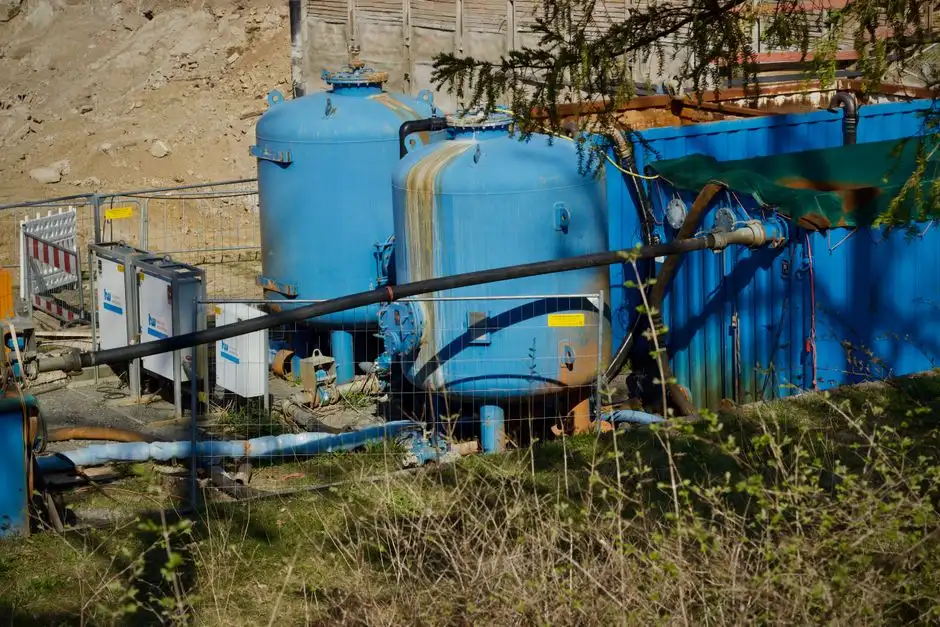
Reverse osmosis concentrates landfill leachate, desalts seawater, and decalcifies power-plant cooling water. It also produces ultrapure water for semiconductor and pharmaceutical lines (Trishitmana et al., 2020). In plant wastewater service, RO is the reuse workhorse. It is the only membrane process that strips monovalent ions, residual organics, and most microbial load in a single pass. A 2026 baseline industrial RO system with up to 95% recovery runs on PLC automation with CIP sequences a mid-level operator can execute. Recovery above 90% is now the procurement norm rather than the exception.
Zero-liquid-discharge adoption is expanding outside oil and gas into food, battery materials, photovoltaics, and PCB manufacturing. Discharge caps often no longer permit even a brine line. A 99.9% recovery ZLD skid in PV manufacturing has been documented with a USD 1.2M ROI case example (per the PV wastewater ZLD design blog). Food and PCB sectors are tracking the same economics. For budgeting, anchor RO pretreatment pricing with the ultrafiltration system cost in 2026 sizing guide: CAPEX USD 50K–800K and OPEX USD 0.08–0.30/m³ depending on flux, feed quality, and automation level.
The 2026 economics now favour ZLD wherever freshwater cost exceeds roughly USD 2/m³. They also favour ZLD where the regulator has signalled a zero-discharge future. The RO train delivers 70–95% reuse; the ZLD polish closes the loop. Buyers mapping Gulf-region permit pressure can cross-check the Ajman 2026 engineering and compliance guide for a parallel equipment stack.
Technology Trend #3 — AI Process Control and Digital Twins
The control stack on a 2026 WWTP has moved past rule-based SCADA. ML and LSTM-based controllers now modulate aeration DO setpoints, polymer dosing, and backwash intervals against live sensor data. Fixed timers no longer set the rhythm. Digital-twin models let operators run failure scenarios against the live plant before committing to a setpoint change. Per the AI in wastewater treatment forecast to 2030, this segment is on a 22.4% CAGR trajectory to USD 11.5B by 2030, well above the underlying equipment market.
Quantified OPEX impact from 2025–2026 case studies shows 15–25% energy savings on aeration. Polymer consumption falls 20–30% when AI dosing replaces timer-based chemical feed (engineering depth in the AI process control municipal guide). Those numbers are conservative. The upper end shows up on plants with variable influent — food, textile, metal-finishing — where load swings are widest.
The honest scoping question a buyer must answer first is data infrastructure. AI control is only as good as its sensors. The 2026 prerequisite list is short and non-negotiable: online ammonia-N, oil & grease, pH, and TSS analyzers feeding the PLC at intervals no longer than five minutes. If those signals are not in the 2026 capex line, the digital-twin ROI does not materialize.
Regulatory Trends Shaping 2026 Equipment Selection
Three regulatory regimes still do the heavy lifting on 2026 capex decisions. In the EU, the Urban Waste Water Directive 91/271/EEC combined with BAT conclusions under IED 2010/75/EU continues to force tertiary upgrades. Sites discharging to municipal WWTPs and direct dischargers above IED thresholds are both in scope. Directive (EU) 2024/1785, published 15 July 2024, amends that IED framework. It pushes competent authorities toward the strictest achievable emission limit values within BAT-AEL ranges (EUR-Lex, 2024).
In the US, the PFAS NPDWR finalized on 10 April 2024 remains the largest near-term driver for metal-finishing, paper, and textile sites. Earlier buyer briefs treated those limits as a 2026 enforcement cliff. According to US EPA (2024), public water systems had three years for initial monitoring (through 2027) and five years (by 2029) to meet PFOA/PFOS MCLs. In China, the GB 18918-2002 trajectory has tightened ammonia-nitrogen and total-nitrogen limits. That push is driving MBBR and MBR retrofits across chemical and electronics clusters.
Southeast Asia and Africa are not standing still. Indonesia's PP 22/2021 sets a BOD discharge limit framework that pushes food and textile plants toward biological-plus-polishing trains. South Africa's NEMWA enforces a similar tightening. Malaysia's EQA 1974 framework is tightening ammonia and colour limits for textile effluent. The compliance burden is regional but the equipment answer is converging: MBR or MBBR front end, RO or ZLD back end, online analyzers throughout. For a location-specific example of how those trains are scoped under local discharge rules, see this guide to industrial wastewater treatment in Rajshahi.
| Region | Key 2026 Rule | Treatment Implication |
|---|---|---|
| EU | BAT conclusions under IED 2010/75/EU; Directive (EU) 2024/1785 amendment | Tertiary polishing, stricter N&P, micropollutant monitoring |
| US | PFAS NPDWR (finalized 2024; MCL compliance originally by 2029, proposed extension to 2031) | RO/UF polishing, GAC or IX for PFOA/PFOS |
| China | GB 18918-2002 trajectory updates | MBR/MBBR retrofits for ammonia-N and TN |
| Indonesia | PP 22/2021 Baku Mutu | BOD/COD limits, biological-plus-polishing — see the BOD discharge limit in Indonesia 2026 compliance guide |
| South Africa | NEMWA / Green Drop | Stricter effluent and sludge reporting |
| Malaysia | EQA 1974 amendment | Colour and ammonia limits for textile, food |
2026 Industrial WWTP Segment Forecasts at a Glance
Industrial WWTP procurement teams should use the table below as a 2026 directional view across five equipment segments. MBR sits in the mid-teens CAGR band, led by industrial process water and decentralized municipal reuse. RO/UF tracks the broader membrane market, with pharma and semiconductor demand pulling the upper bound. ZLD is the highest-growth band at 14–18% CAGR, driven by battery materials, semiconductor, and food-sector reuse mandates. Chemical dosing growth follows tighter trace-contaminant limits that need more precise reagent control. Sludge dewatering remains a cost-reduction focus, with buyers prioritizing volume-reduction technologies that cut haul-off spend (see the seven proven strategies in the 2026 sludge dewatering cost blog).
| Segment | 2026 Directional CAGR | Key 2026 Buyer Signal |
|---|---|---|
| MBR | Mid-teens | Process-water reuse and decentralized municipal; falling unit membrane cost |
| RO / UF | High single-digit to low-teens | Pharma, semiconductor, and PFAS-driven polishing demand |
| ZLD | 14–18% | Battery, semiconductor, food reuse mandates; brine-line curtailment |
| Chemical Dosing | Mid single-digit | Precise reagent control for trace contaminants; AI dosing pulls premium |
| Sludge Dewatering | Low-to-mid single-digit | Haul-off cost reduction focus — see sludge dewatering cost strategies for 2026 |
What This Means for Industrial Buyers in 2026
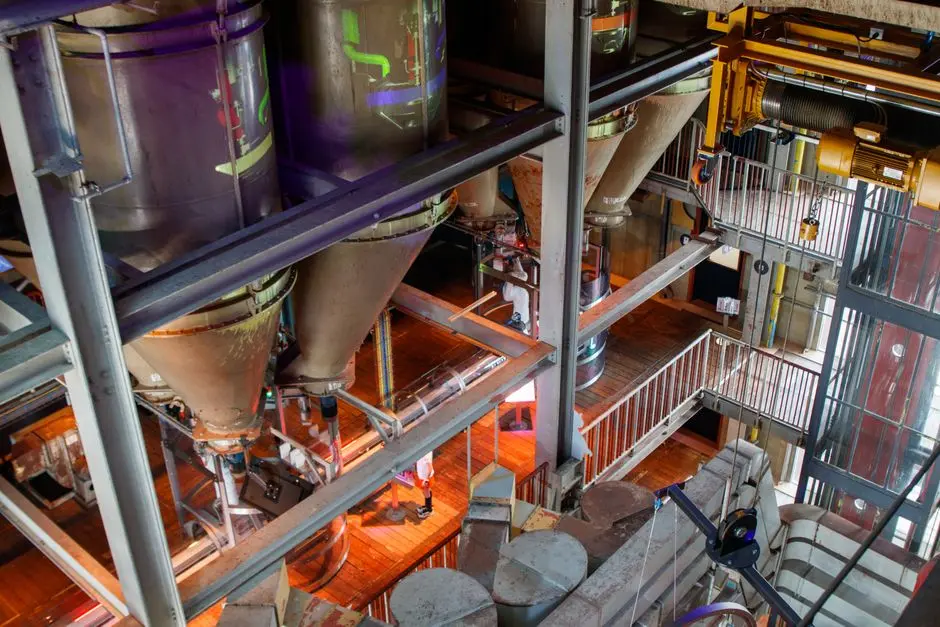
Industrial buyers should convert 2026 technology and regulatory signals into an influent-driven selection matrix. Low-strength, low-flow decentralized sites (car washes, small food lines, remote staff facilities at 1–80 m³/h) fit the WSZ package-plant envelope. Those skids install fast and suit discharge-to-sewer or irrigation reuse. High-FOG, high-TSS streams from food, paper, and metalworking need a dissolved air flotation system in the 4–300 m³/h range ahead of biology. Sites targeting ≥70% water reuse or facing PFAS- or nitrogen-driven caps need the full integrated MBR membrane bioreactor system paired with an industrial RO system with up to 95% recovery.
| Influent Profile | Recommended Primary Unit | Expected 2026 CAPEX Band |
|---|---|---|
| Low-strength, low-flow decentralized (1–80 m³/h) | WSZ package plant | USD 25K–150K (skid-built) |
| High-FOG, high-TSS (food, paper, metalworking, 4–300 m³/h) | DAF + downstream biological | USD 60K–250K (pre-treatment skid) |
| Reuse ≥70% or PFAS / TN-driven caps | Integrated MBR + RO train | USD 200K–2.5M (full train with controls) |
Buyers should also treat AI control as a retrofit option rather than a new-build requirement if existing analyzers are already PLC-tied. The retrofit is often the highest-ROI line item on a 2026 board memo. These market trends also change when boards should open RFQs: lock membrane quotes early in the year, then sequence AI retrofit once sensors are proven.
2026 selection checklist
- Confirm discharge permit limits for BOD, COD, ammonia-N, TN, TSS, colour, and any PFAS or micropollutant clauses.
- Decide reuse target (≥70% usually locks MBR + RO; ZLD when freshwater exceeds about USD 2/m³ or brine lines are curtailed).
- Size pretreatment for FOG/TSS before biology — DAF for high-FOG streams in the 4–300 m³/h band.
- Budget online ammonia-N, O&G, pH, and TSS analyzers at ≤5-minute PLC intervals if AI control is in scope.
- Compare Q1 vs Q4 MBR membrane quotes; most 2024–2026 unit-cost compression is already captured.
- Separate AI-control retrofit CAPEX from civil works when analyzers already exist.
- Align board timing with US PFAS monitoring (through 2027) and EU BAT permit reviews after Directive (EU) 2024/1785.
12-Month Outlook: What to Watch Between Now and 2027
Plant managers should put three dated regulatory signals on the 2026–2027 calendar. First, US PFAS milestones: earlier guidance framed 2026 as the hard enforcement year. The 2024 NPDWR still sets initial monitoring through 2027 and MCL compliance originally by 2029. EPA is proposing optional extensions to 2031 for PFOA/PFOS (EPA, 2025–2026). State-level rules in California and New Jersey continue to layer additional requirements. Second, the EU IED revision cycle: Directive (EU) 2024/1785 is already in force. Draft BAT updates typically surface 12–18 months before formal adoption, so Q3 2026 is when plant managers should review proposed scopes. Third, China's next GB update: watch the MEE bulletins for revised ammonia-N and TN limits. Those notices historically precede MBR retrofit waves by six to nine months.
On procurement timing, MBR membrane unit cost is still drifting down. Buyers waiting past Q3 2026 should expect only single-digit price erosion. Most of the 2024–2026 membrane-cost compression has already been captured. On subsidies, AI-control retrofit programs are emerging in several EU member states and in selected US states. Application windows tend to be short and competitive.
Who This Is For and Next Step
This outlook is for plant engineers, EPC contractors, and procurement managers sizing 2026 WWTP CAPEX under reuse, PFAS, or nutrient caps. Buyers chasing only low-cost sewer discharge with stable, low-strength influent and no reuse target can stay with simpler package plants and skip ZLD. If your influent profile, reuse target, or permit timeline is already defined, request a scoped equipment proposal via our request a quote form with flow, COD, and discharge limits attached.
Frequently Asked Questions
What is driving industrial wastewater market growth in 2026?
Three forces drive growth: tighter discharge limits, water-scarcity pricing, and ESG audit mandates. Limits include the US PFAS NPDWR, EU IED amendments with BAT conclusions, and China GB updates. Reuse now offsets cost instead of only adding compliance spend. The AI-in-wastewater segment is forecast to reach USD 11.5B by 2030 at a 22.4% CAGR, roughly six times equipment-market pace.
How much does an MBR system cost in 2026?
Industrial MBR skids sized for 5–500 m³/d typically fall in the USD 150K–1.5M CAPEX band, with OPEX dominated by aeration energy (0.3–0.8 kWh/m³) and membrane replacement every 5–8 years. For RO pretreatment sizing, see the ultrafiltration system cost in 2026 for the full CAPEX/OPEX breakdown across flux and automation levels.
When does ZLD make economic sense for an industrial plant?
ZLD becomes the rational choice when freshwater cost exceeds roughly USD 2/m³, when the local regulator has signalled a zero-discharge future, or when brine-line disposal is curtailed. PV, food, and PCB sector case studies show 99.9% water recovery with documented ROI cases, including a USD 1.2M PV manufacturing reference used for board-level budgeting.
Which 2026 regulations most affect industrial buyers?
Three regimes drive most 2026 capex. The US PFAS NPDWR was finalized in 2024, with monitoring through 2027 and MCL compliance originally by 2029; EPA has proposed extensions to 2031. Directive (EU) 2024/1785 amends IED 2010/75/EU. China's GB 18918-2002 trajectory keeps tightening ammonia-N and TN. Indonesia PP 22/2021, South Africa NEMWA, and Malaysia EQA 1974 are tightening in parallel.