Why a 2012 Sludge-Bulking Incident Still Defines the AI Opportunity
During the 2012 Spring Festival, Beijing Drainage Group lost control of activated sludge at a major plant when filamentous bulking pushed mixed-liquor solids past the secondary clarifiers. Fu Wei, a plant engineer on duty that week, later told CGTN that "all of our 40 plus staff had to collect the floating sludge manually" through the holiday to keep solids out of the receiving river (CGTN, 2019-10-31). The root cause was detection latency: the lab SVI result confirming bulking took 6–8 hours to return, by which time 30+ tons of sludge had already escaped the aeration train. A modern LSTM-based process controller running on the same DO and MLSS signals would have flagged the rising SVI trajectory in roughly 30 minutes, giving operators the lead time to dose chlorination or adjust wasting before the clarifier failed.
That gap — 6-hour lab versus 30-minute AI inference — is the operational case for the entire category. Macro data reinforces it: the UN/WHO report cited in the same CGTN coverage puts the globally untreated wastewater share at 41% across 79 mostly high- and middle-income countries (excluding much of Asia and Africa), a figure that has barely moved in a decade. The question for plant managers in 2026 is no longer whether AI enters the WWTP, but which AI to buy, at what capital cost, and on what timeline to 2030.
AI in Wastewater Treatment: 2026 Baseline and 2030 Market Forecast
The AI-in-wastewater-treatment market is forecast to grow from roughly $2.9B in 2026 to $11.5B by 2030, a 41% CAGR — far outpacing the broader $88B wastewater services market growing at 6.8% CAGR. The headline anchor comes from the IndustryArc Wastewater Treatment Services Market report (2024-2030), which sizes the overall services opportunity at $88.00Bn by 2030 at 6.80% CAGR. AI-specific sub-segments — ML control (38% CAGR), digital twin platforms (38% CAGR), and smart/soft sensors (24% CAGR) — are growing roughly 5–6× faster than the parent market, which is the mathematical reason the AI slice expands from roughly 3% to 13% of total WWTP spend over the forecast window.
Market scope splits into three layers: software (ML platforms, digital twins, soft-sensor libraries), services (integration, model tuning, cybersecurity hardening), and edge hardware (AI-enabled PLCs, smart sensor retrofits). Geographic weight tilts toward mature regulatory markets in 2026 and toward Asia-Pacific by 2030.
| Segment | 2026 Share | 2030 Forecast | CAGR 2026-2030 |
|---|---|---|---|
| AI in WWTP (software + services + edge) | $2.9B | $11.5B | ~41% |
| Broader WWTP services market (anchor) | ~$60B | $88.0B | 6.80% |
| North America (AI share) | ~38% | ~32% | ~36% |
| Europe (AI share, EU UWWTD recast driver) | ~28% | ~28% | ~41% |
| Asia-Pacific (AI share, fastest growth) | ~26% | ~33% | ~48% |
| Industrial end users (chemical, F&B, pharma, semi) | ~46% | ~54% | ~45% |
| Municipal end users | ~54% | ~46% | ~37% |
Industrial overtook municipal as the largest spend segment by 2024 in most regional cuts, and the gap widens through 2030 because chemical, F&B, and semiconductor plants face the tightest reuse and PFAS timelines (source: IndustryArc, 2024-2030; regional split triangulated from vendor disclosures, 2025).
The Five AI Technologies Reshaping Industrial Wastewater Plants
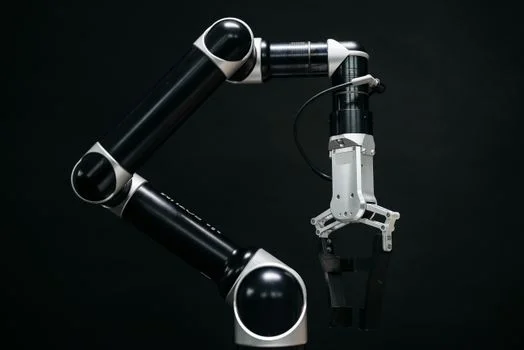
Five distinct AI technology stacks now compete for the industrial WWTP dollar, and they are not interchangeable. A plant manager buying a soft sensor to avoid a $40,000 online BOD analyzer is making a different decision from one commissioning a full digital twin for closed-loop water reuse.
| Technology | Typical Accuracy / Performance | Industrial Use Case | 2026-2030 CAGR |
|---|---|---|---|
| ML process control (LSTM, gradient boosting) | 10-30% aeration energy reduction | DO/MLSS setpoint optimization in activated sludge | ~38% |
| Soft / virtual sensors (BOD, COD, TN, TP) | <8% MAPE at industrial sites | Replace online analyzers; 60-80% lower CAPEX than hardware | ~24% |
| Digital twin platforms | What-if + operator training; ±5-10% mass-balance fit | Process simulation, reuse optimization, capex justification | ~38% |
| Computer vision (foam, color, floating sludge) | >95% detection on trained classes | 24/7 edge cameras replacing manual rounds | ~32% |
| LLM / SCADA copilots | Alarm triage, NL query of historian data | Operator decision support, SOP generation | ~55% (from low base) |
ML process control is the largest deployed category. Alam et al. (2022, Chemical Engineering Journal) and a 2024 Springer review both report 10–30% aeration energy reductions when LSTM or gradient-boosted models replace fixed DO setpoints. Soft sensors are the cheapest entry point: an AI estimator of BOD, COD, TN, or TP from proxy signals (pH, ORP, turbidity) typically runs below 8% MAPE at industrial sites and costs 60–80% less than the online analyzer it replaces — see our online BOD analyzer cost in 2026 benchmark for the hardware side of that comparison. Digital twins grew fastest on a percentage basis at the high end. Computer vision directly addresses the 2012 Beijing failure mode: an edge AI camera over the clarifier launder would have flagged floating sludge well before 30 tons escaped. LLM/SCADA copilots are the emergent tier — fewer than 5% of industrial deployments as of early 2026, but the highest growth rate. The underlying chemistry is unchanged: secondary treatment still removes 85–95% of BOD and TSS to ≤30 mg/L effluent; AI's job is to do that with less energy, more stability, and faster recovery from shock loads.
Where AI Delivers the Strongest ROI: Industrial Sector Use Cases
Mapping technology to sector is where most procurement decisions go wrong. The ROI distribution is uneven, and it tracks influent variability, discharge limits, and reuse intensity more than plant size.
Chemical and petrochemical: Variable influent shocks and high organic load make ML aeration control the highest-yield investment, with 15–25% energy reduction documented in field deployments. Food & beverage (dairy, brewery, slaughterhouse): high organic variability favors AI carbon-source dosing tied into a PLC-controlled automatic chemical dosing system for stable denitrification. Pharma and semiconductor: ultra-low discharge limits and high water reuse ratios drive digital-twin investment for closed-loop optimization — see our digital twin cost benchmark for industrial WWTPs. Pulp & paper and textile: AI color and foam vision systems replace 2–4 operator shifts per day on visual inspection rounds. Mining and metal finishing: AI enables real-time heavy-metal precipitation control to meet tightening 2026–2030 PFAS and metals limits; see the PFAS removal technology forecast to 2030 for the regulatory driver.
A Buyer's Decision Framework: Which AI to Deploy at Your Plant
Translate the technology map into a CAPEX-tiered shortlist. The framework below assumes a 5–50 MLD plant with a working PLC layer; greenfield EPC projects shift the entry point up by one tier.
| Tier | CAPEX Range | Payback | Typical Deployment | Best-Fit Plant |
|---|---|---|---|---|
| Tier 1 | Under $50K | <6 months | Soft sensors + ML aeration on existing PLC | 5-50 MLD with PLC + 4-20 mA |
| Tier 2 | $50K-$500K | 12-24 months | Digital twin + LLM/SCADA copilot | 10+ MLD with historian + OPC-UA |
| Tier 3 | $500K+ | 24-48 months | Full AI-native plant design | Greenfield or major retrofit (EPC-driven) |
Decision rule: if your plant already has PLC plus 4-20 mA instrumentation, start Tier 1. If you also have a historian and OPC-UA layer, jump to Tier 2. Skip Tier 1 only if your scope is a greenfield build or a major retrofit tied to a capacity expansion. For shortlisting vendors against this framework, the AI process control supplier comparison lays out the 2026 vendor landscape by tier.
Integration Reality: PLC, SCADA, and the Path from Pilot to Plant-Wide AI
Industry estimates put AI pilot failure rates at 60%+, and the dominant cause is integration, not model accuracy. Data readiness is the primary blocker: more than 70% of mid-sized industrial plants lack the historian and tag-naming discipline that an ML pipeline requires, and most SCADA tag databases are mapped for human operators, not for time-series feature engineering. Aeration ML can run on a modern industrial PLC, but a full digital twin typically needs an edge gateway plus a cloud or on-prem inference layer — the PLC control cost factors in 2026 explain why that hardware line item is often larger than the software license.
Cybersecurity is the second-most-common failure mode. AI endpoints — OPC-UA servers, MQTT brokers, edge gateways — add a new OT/IT attack surface that the IEC 62443 standard was not originally written to cover, but which the 2024 amendments address directly. The cheapest de-risking step is a 90-day pilot scoped to one aeration basin and one KPI (typically kWh/kg BOD removed). Pilots that chase three KPIs across two basins usually fail on data plumbing before the model is ever validated.
2026–2030 Adoption Roadmap and Regulatory Tailwinds

Regulation is now the strongest pull factor for industrial AI adoption, and three jurisdictions are setting the pace. The EU Urban Waste Water Directive recast (adopted 2024) adds micropollutant and PFAS monitoring obligations that AI soft sensors can automate at a fraction of online-analyzer cost. China's Water Ten Plan Phase II pushes continuous AI-based discharge reporting in key industrial provinces, with provincial enforcement starting 2026. In the US, the EPA PFAS NPDWR rule and state-level effluent limits (notably California's and New Jersey's) drive digital-twin adoption for reuse compliance by 2028 — the PFAS removal technology forecast to 2030 details the compliance math.
The realistic adoption sequence for a 5–50 MLD industrial plant: 2026–2027 soft-sensor and ML aeration pilots (Tier 1), 2027–2028 digital-twin scoping tied to a reuse or PFAS compliance project (Tier 2), 2029–2030 AI-as-default in new plant design and major retrofits. Plants that skip Tier 1 and try to buy a Tier 3 platform without in-house data discipline typically stall in the integration phase for 12–18 months.
Frequently Asked Questions
How large is the AI in wastewater treatment market by 2030? The AI-in-WWTP market is forecast to reach roughly $11.5B by 2030, up from $2.9B in 2026, a 41% CAGR versus 6.8% for the broader $88B wastewater services market (source: IndustryArc 2024-2030; AI slice triangulated 2025-2026).
Which AI technology is growing fastest in wastewater? LLM/SCADA copilots are growing fastest from a small base (~55% CAGR), followed by ML process control and digital twin platforms tied at ~38% CAGR through 2030.
What CAPEX should a 10 MLD industrial plant budget for AI? Tier 1 deployments (soft sensors plus ML aeration on existing PLC) typically run under $50K with payback under 6 months; Tier 2 digital-twin plus copilot projects run $50K-$500K with 12–24 month payback.
What is the typical payback period for ML aeration control? Field deployments report 10–30% aeration energy reduction, translating to 4–8 month payback at 2026 industrial electricity tariffs for plants above 5 MLD (Alam et al., 2022; Springer 2024 review).
Which regulation is driving industrial AI adoption fastest? The EU Urban Waste Water Directive recast (2024) is the strongest single driver, followed by the US EPA PFAS NPDWR rule and China's Water Ten Plan Phase II continuous discharge reporting requirements.
Which plant size should adopt AI first? 10–50 MLD industrial plants with an existing PLC and historian layer deliver the fastest ROI because they sit at the intersection of available data, scale to absorb CAPEX, and regulatory pressure from PFAS or reuse rules.
Related Equipment
- PLC-controlled automatic chemical dosing system — specifications, capacity range, and technical data