Why 2024-2026 Regulations Redefine PFAS Treatment Targets
The 2024 US EPA final MCL of 4.0 ng/L (4 ppt) for PFOA and PFOS, combined with a Hazard Index of 1 for the four-component mixture of HFPO-DA, PFNA, PFHxS, and PFBS, has reset every industrial PFAS discharge calculation built before April 2024. Industrial wastewater from semiconductor, electroplating, and PFAS manufacturing sectors now faces 10-100 ng/L site-specific limits under the 2024 Multi-Sector General Permit revisions, with PFAS monitoring required at every outfall above 100,000 gallons per day. In the EU, the recast Drinking Water Directive proposes 0.1 ng/L for the sum of 20 PFAS, and REACH Annex XVII is moving toward a sweeping PFAS Restriction built on a "destroy, don't transfer" principle that will end the practice of shipping spent GAC across borders for incineration. China added PFAS monitoring parameters to GB 5749-2022 drinking water standards, and provincial discharge permits in Guangdong and Jiangsu are mirroring EU numerical thresholds for PFOA and PFOS. The hidden problem is ultra-short-chain PFAS (C<4): Neuwald et al. (2022, Environ. Sci. Technol.) detected trifluoroacetate and similar species in German drinking water at ng/L levels that granular activated carbon (GAC) cannot consistently remove, closing the gap that long-chain chemistry left open.
The Five PFAS Treatment Technology Families: What Each Does and Does Not Solve
Every PFAS technology on the market in 2026 falls into one of two camps: separation technologies that concentrate PFAS into a smaller waste stream, and destruction technologies that mineralize the C-F bond. The distinction matters because concentrated waste is not eliminated — it is stored, shipped, or incinerated, and incineration of PFOA/PFOS above 1,100°C produces incomplete combustion products that regulators are now scrutinizing under EPA's 2024 CERCLA designation.
GAC adsorption remains the default polishing step for low-concentration streams. Lee et al. (2024) reported 92.5-95.3% removal for six PFAS with perfluorocarbon chain lengths of 4-8 at a 20 mg/L GAC dose, but real water matrices cut performance sharply: dissolved organic matter causes competitive inhibition, pore blocking, and electrostatic repulsion (Ateia et al., 2019), while inorganic anions compete for adsorption sites. Spent GAC loaded with PFOA/PFOS is classified as hazardous waste under EPA RCRA TK-6275 (2024), with disposal costs of $400-$800 per ton.
Ion exchange (IX) resins (Purolite PFA694E, CalRes 2301) deliver 1.5-2× higher capacity than GAC for short-chain PFAS and can be regenerated with brine, but media cost runs 2-3× higher and regeneration produces 5-10% of feed volume as PFAS-laden brine that still requires destruction.
Nanofiltration and reverse osmosis reject PFOA at 99.4-99.8% in mixed-matrix composite membranes (npj Clean Water, 2023). Recovery rates sit at 85-95%, but the concentrate carries PFAS at 100-1,000× feed concentration — typically 5-20% of feed volume. That concentrate is the design problem the rest of the train must solve.
Photocatalytic destruction moved from lab curiosity to industrial pilot in 2024. The KQGZ organic photocatalyst (USTC, Nature 2024, 635: 610-617) achieves complete defluorination at 40-60°C under 407 nm visible light, converting PFAS to amorphous carbon and fluoride salts. The BPI/n-Bu4NF system (Colorado State, Nature 2025, 637: 601-607) reaches the same endpoint via proton-coupled electron transfer. Both run at ambient pressure with no secondary waste stream beyond fluoride-bearing water that passes through standard polishing.
Electrochemical oxidation (EO), plasma, and supercritical water oxidation (SCWO) deliver 95-99% destruction across long- and short-chain PFAS but require CAPEX of $5-15M per 10 m³/h unit (HydropureWater field data, 2026), which limits adoption to high-concentration industrial streams until 2028.
| Technology Family | Removal / Destruction Efficiency | Secondary Waste | CAPEX (per 100 m³/h, USD) | OPEX (USD/m³) | 2026 Status |
|---|---|---|---|---|---|
| GAC adsorption | 85-95% (C4-C10), <60% (C<4) | Spent GAC, hazardous | 150,000-400,000 | 0.30-0.80 | Mature |
| Ion exchange | 90-98% (C2-C10) | Regeneration brine | 250,000-600,000 | 0.50-1.20 | Mature |
| NF / RO | 95-99.8% rejection | Concentrate (5-20% feed) | 400,000-1,200,000 | 0.50-1.50 | Mature |
| Photocatalytic destruction | >99% defluorination | Fluoride salt solution | 2,000-5,000 per kg PFAS/day | 0.80-2.00 | Pilot to early commercial |
| EO / SCWO / plasma | 95-99% | Fluoride salt, minimal organics | 5,000,000-15,000,000 | 1.50-4.00 | Industrial pilot |
The MBR polishing step in the PFAS treatment train reduces COD below 50 mg/L and strips PFAS precursors that would otherwise exhaust downstream GAC, while the reverse osmosis concentration stage for PFAS recovery produces the 20-100× concentrate that destruction technologies are designed to process.
2030 Forecast: Where the Market Is Moving and Why
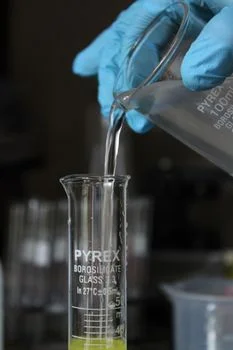
Forecasts for the global PFAS treatment market converge on a roughly 2.7× expansion by 2030 — from approximately $2.8B in 2026 to $7.5B by 2030, driven by compliance capex, remediation liabilities, and the EU's "destroy, don't transfer" principle. GAC and IX combined will see their share of new industrial PFAS capex fall from 55% in 2026 to roughly 35% by 2030. The reason is cost crossover: destruction is currently $3-8 per kg PFAS destroyed, and photocatalytic systems are tracking toward sub-$1/kg by 2030 as KQGZ-class catalysts scale. Photocatalytic and electrochemical destruction combined will grow from under 5% of 2026 industrial PFAS capex to 25-30% by 2030. The 2027 inflection point is EPA's CERCLA designation of PFOA and PFOS as hazardous substances: once remediation sites cannot ship spent media off-site, on-site destruction becomes the only compliance path for any plant generating more than 1 kg/day of total PFAS in spent GAC or brine. China's 14th Five-Year Plan extension (2026-2030) funds provincial PFAS destruction hubs in Guangdong, Jiangsu, and Zhejiang, but in-plant treatment is favored for any facility generating more than 50 m³/day of PFAS-bearing wastewater, and this is where the technology mix is shifting fastest.
Industrial Treatment Train Design: Where DAF, MBR, and RO Fit
No single technology handles industrial PFAS wastewater at 2026 discharge limits in one pass. The defensible architecture for a 50-500 m³/day stream from semiconductor, plating, or textile operations is a four-step train: pre-treatment, biological polishing, membrane concentration, and destruction. Each step has a specific job and a measurable endpoint.
| Step | Equipment | Function | Typical Capacity | Outlet Spec |
|---|---|---|---|---|
| 1. Pre-treatment | DAF | Remove FOG, surfactants, PFAS-bound TSS | 4-300 m³/h | TSS <30 mg/L |
| 2. Biological polishing | MBR | Reduce COD, break down PFAS precursors | 10-200 m³/h | COD <50 mg/L |
| 3. Concentration | NF or RO | Reject 95-99% PFAS, recover 85-95% permeate | 10-100 m³/h | Concentrate at 20-100× feed |
| 4. Destruction | Photocatalytic / EO / SCWO | Mineralize C-F bond in concentrate | 0.5-10 m³/h | <10 ng/L discharge |
Step 1 — industrial DAF pre-treatment for PFAS-bearing wastewater — removes free oil, grease, and the suspended solids that carry sorbed PFAS. Without it, membrane flux drops 30-50% within weeks. Step 2 — the MBR — strips biodegradable organics that would otherwise foul the RO and consume downstream GAC capacity on competitive adsorption. Step 3 uses a multi-media pre-filter for NF/RO membrane protection ahead of the RO skids. Step 4 processes the 5-20% concentrate volume; for high-volume sites above 200 m³/day, ion exchange with electrochemical regeneration is the 2027-2030 default because it avoids the brine loop entirely.
CAPEX and OPEX Comparison: 2026 Prices and 2030 Projections
Procurement teams building a 2026-2030 capex case need defensible numbers with a forward curve, not snapshot pricing. The table below shows current installed costs and a 2030 forecast range based on catalyst scaling, membrane lifetime extensions, and concentrate-disposal cost trajectories.
| System (100 m³/h basis) | 2026 CAPEX (USD) | 2026 OPEX (USD/m³) | 2030 CAPEX (USD) | 2030 OPEX (USD/m³) | Main OPEX Driver |
|---|---|---|---|---|---|
| GAC contactor | 150,000-400,000 | 0.30-0.80 | 150,000-400,000 | 0.40-1.00 | Media replacement every 6-12 mo |
| NF / RO skids | 400,000-1,200,000 | 0.50-1.50 | 400,000-1,200,000 | 0.45-1.30 | Membrane replacement 3-5 yr, concentrate disposal $200-500/m³ |
| Photocatalytic destruction (per kg PFAS/day) | 2,000-5,000 | 0.80-2.00 | 500-1,500 | 0.30-0.90 | Catalyst replacement, electricity |
| EO / SCWO reactor | 5,000,000-15,000,000 | 1.50-4.00 | 3,000,000-8,000,000 | 0.80-2.50 | Electrode replacement, energy |
| Full hybrid train (DAF+MBR+RO+destruction) | 2,500,000-6,000,000 | 3.00-6.00 | 2,000,000-4,500,000 | 1.20-2.50 | Energy, concentrate handling |
The hybrid train OPEX in 2026 is dominated by concentrate disposal and GAC media replacement; by 2028, the same train is expected to run at $1.20-$2.50/m³ because destruction costs fall and concentrate incineration is no longer a compliance option in the EU. For facilities with fluoride-bearing destruction byproducts, the engineering considerations described in fluoride removal from PFAS-defluorination byproducts add a calcium precipitation stage that adds $0.10-$0.25/m³ to OPEX. A detailed breakdown of membrane-related operating costs for the NF step appears in the nanofiltration OPEX in PFAS treatment trains analysis, and the broader 2030 industrial wastewater treatment forecast places PFAS within the wider capex wave for plant-level treatment.
Frequently Asked Questions
What is the cheapest PFAS removal technology in 2026?
GAC adsorption at $0.30-$0.80/m³ OPEX remains the lowest-cost option for polishing streams already below 100 ng/L, but it generates hazardous spent media costing $400-$800/ton to dispose. Total compliance cost is higher than destruction once disposal, monitoring, and CERCLA liability are included (per RCRA TK-6275, 2024).
Which PFAS technology handles ultra-short-chain PFAS like TFA?
Reverse osmosis rejects TFA at 85-95% and photocatalytic destruction using KQGZ-class catalysts achieves complete defluorination at 40-60°C. GAC and standard IX fail below 60% removal for C<4 species (Neuwald et al., 2022).
When will on-site PFAS destruction become cheaper than GAC plus off-site incineration?
The crossover is forecast for 2027 in the EU and 2028-2029 in the US, once REACH PFAS Restriction and CERCLA remediation rules end cross-border shipment of spent media and photocatalytic CAPEX falls below $1,500 per kg PFAS/day (per 2030 forecast in this article).