Desalination Market Growth Rate in 2026: What the Headline Number Means
The global desalination market is projected to grow from USD 20.76 billion in 2026 to USD 38.20 billion by 2033, registering a compound annual growth rate of 9.1% from 2026 to 2033. Growth is driven by freshwater scarcity, climate stress, and industrial water demand, with seawater reverse osmosis capturing the largest technology share as recovery rates climb toward 95%. Two competing 2026 baselines are circulating in the procurement community, and reconciling them is the first step before any CAPEX model is built. The Business Research Company reports USD 17.76 billion in 2025 rising to USD 38.80 billion by 2034 at 9.07% CAGR. A second, Coherent/Mordor-aligned dataset reports USD 20.76 billion in 2026 to USD 38.20 billion by 2033 at 9.1% CAGR. The endpoints differ by less than 2%, and the CAGR difference is 0.03 percentage points — well inside the normal variance between syndicated research methodologies that use different plant-count inclusions and EPC pipeline weighting.
For an industrial procurement team, the 9.1% CAGR is a structural signal, not a soundbite. Freshwater scarcity is widening: UN demographic projections put 2.4 billion people in water-stressed regions by 2025, with the Middle East, North Africa, and South Asia accounting for the bulk of new municipal tender activity. Desalination is the process of removing dissolved salts and minerals from saline water to produce freshwater suitable for municipal supply, industrial process water, or potable use. That definition is the working scope for the rest of this article.
Why 9.1% CAGR and Not Higher — and Why Not Lower
Upside drivers are real and quantifiable. Drought and desertification are expanding in the Middle East, North Africa, and South Asia at rates that have triggered national water strategies in Saudi Arabia, the UAE, and Kuwait. Industrial water reuse mandates in China and the EU are forcing thermal power, semiconductor, and EV battery fabs onto recycled or desalinated sources. A modern semiconductor fab consumes 5–10 m³ of UPW-grade water per million USD of output, and lithium battery material plants sit at the upper end of that band.
The structural ceiling on a higher CAGR is energy and brine. Thermal desalination (MSF, MED) still consumes 3–5 kWh/m³, versus 2–4 kWh/m³ for modern SWRO with isobaric energy recovery devices. Brine discharge is tightening under EU BREF and IMO frameworks, raising compliance CAPEX for any plant that cannot recover above 50% on the high-salinity side. The ion exchange membrane market — a key input cost driver for RO and ED — is forecast to grow at only 6.4% CAGR, from USD 1.20 billion in 2025 to USD 2.39 billion by 2036. That sub-market CAGR of 6.4% sits 2.7 percentage points below the desalination headline, which means membrane input cost relief over the next decade will be modest. Industrial buyers planning 2026 CAPEX should not assume a deflationary membrane market; budget against 2025 unit pricing and add a 4–6% annual escalation, not a decline.
Technology Mix in 2026: Where the Growth Actually Lives
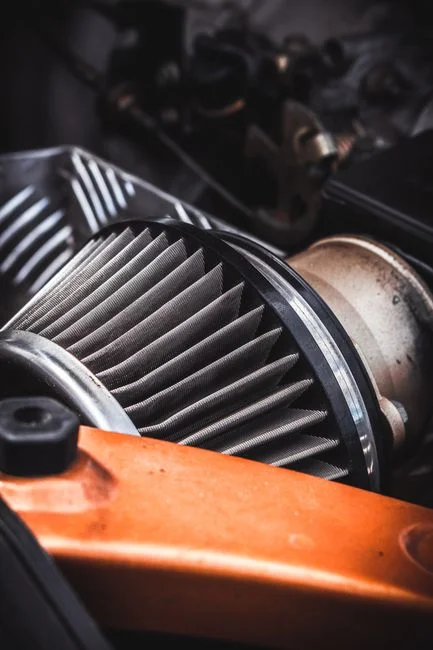
Reverse osmosis (RO) holds 60–70% of new installed capacity in 2026, and within RO, seawater SWRO is the fastest-growing slice because permeate recovery is climbing. An industrial RO system with up to 95% recovery is now standard on greenfield SWRO tenders, up from 70–80% in the 2018–2020 cohort. The 95% recovery ceiling is set by osmotic pressure limits at the concentrate end and by membrane fouling at the tail elements.
Multi-Stage Flash (MSF) and Multi-Effect Distillation (MED) together hold 20–25% of new capacity, concentrated in Gulf-state co-generation plants where waste heat is free or negative-cost. Growth in this segment is flat to modest — typically 1–3% CAGR — because no new MSF megaprojects are tendered outside the Gulf, and the technology is being displaced by SWRO wherever electricity is grid-supplied.
Electrodialysis (ED) and electrodialysis reversal (EDR) hold 3–5% of capacity but are the fastest-growing sub-segment inside brackish water (TDS 500–5,000 mg/L), where RO recovery is constrained by calcium sulfate scaling. ED concentrate polishing lets a brackish plant push overall recovery from 75% into the 85–90% band without antiscalant breakthrough. Forward osmosis (FO) and membrane distillation (MD) remain below 2% share, pre-commercial, but worth tracking for high-salinity brine applications where RO recovery drops below 50% and ZLD economics become unattractive.
| Technology | 2026 Capacity Share | Sub-segment CAGR (2026–2030) | Typical Recovery | Specific Energy | Primary Application |
|---|---|---|---|---|---|
| Seawater RO (SWRO) | 45–55% | 10–12% | 85–95% | 2.5–3.5 kWh/m³ | Municipal + industrial process water |
| Brackish RO (BWRO) | 15–20% | 8–9% | 75–85% | 0.5–1.5 kWh/m³ | Inland industrial, shale, mining |
| MSF | 12–15% | 1–2% | 25–40% | 3–5 kWh/m³ + heat | Gulf co-gen plants |
| MED | 8–10% | 2–3% | 30–45% | 2–3.5 kWh/m³ + heat | Gulf co-gen plants |
| ED / EDR | 3–5% | 11–13% | 80–90% | 1–2.5 kWh/m³ | Brackish concentrate polishing |
| FO / MD | <2% | 15–18% (off small base) | 50–70% | 5–10 kWh/m³ | High-salinity brine, pre-commercial |
Industrial vs Municipal: Who Is Actually Buying in 2026
Municipal buyers still account for 50–55% of global desalination capacity in 2026, driven by GCC national water strategies (Saudi Arabia, UAE, Kuwait) and North African coastal cities such as Algiers, Casablanca, and Tunis. Tender volume in this segment is high, but contract value per m³/day is low because specifications are standardized and brine discharge is straightforward seawater return.
Industrial buyers hold 35–40% share, but the segment is growing at approximately 10–11% CAGR — faster than the overall 9.1% market. The growth is concentrated in three verticals: power plant boiler feed, semiconductor UPW reclaim, and lithium battery material production. The fastest-rising sub-vertical is lithium brine processing in Chile and the US Southwest, where inland brackish feed is paired with ED concentrate polishing. Industrial CAPEX per m³/day is typically 30–60% higher than municipal for the same nominal capacity, because pretreatment is more complex (silica, boron, and organics removal), recovery targets are higher, and brine management is non-negotiable. For procurement, the implication is that an industrial plant bid in 2026 should not be benchmarked against municipal tenders; the 30–60% CAPEX premium is the baseline. Buyers comparing the nutrient recovery outlook for industrial plants and the industrial resource recovery and brine valorization outlook will see that the 10–11% industrial CAGR is anchored by the same drivers — reuse mandates, semiconductor fab build-out, and lithium supply chain expansion.
Regional Outlook: Where the Industrial Buyer Should Look in 2026
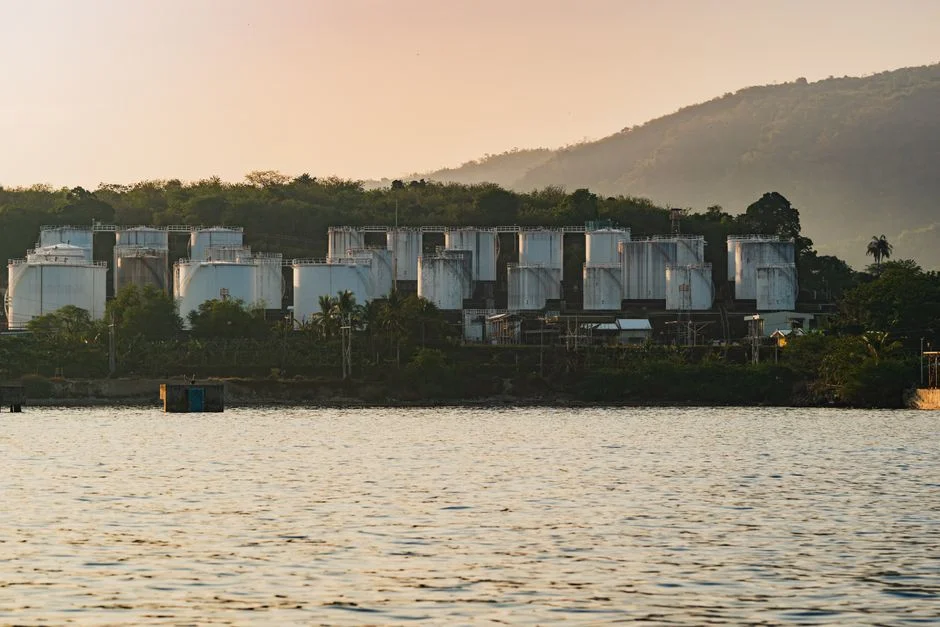
The Middle East and Africa region is the largest absolute market in 2026 at USD 6–7 billion, dominated by co-financed megaprojects — Rabigh 3, Jubail 3B, and the NEOM line. Entry for non-pre-qualified vendors is closed; EPC pre-qualification is a 12–18 month process. Asia-Pacific is the fastest-growing region at 10–12% CAGR, led by China coastal (Tianjin, Caofeidian, Beijiang), India (Chennai Desalination Phase III, Mundra), and Singapore's NEWater expansion. The Americas hold a USD 3–4 billion slice, with Texas, California, and Chile's mining sector driving demand; brackish water dominates over seawater because of inland shale and lithium brine requirements. Across all three regions, vendor entry is gated by local content rules, brine discharge limits, and EPC bonding capacity.
| Region | 2026 Market Size | 2026–2030 CAGR | Dominant Feed Source | Industrial CAPEX Benchmark (USD/m³/day) | Entry Barrier |
|---|---|---|---|---|---|
| Middle East & Africa | USD 6–7B | 8–9% | Seawater (Gulf), brackish (N. Africa inland) | 1,100–1,500 | EPC pre-qualification |
| Asia-Pacific | USD 5–6B | 10–12% | Seawater (China coastal, India), reclaimed (Singapore) | 900–1,300 | Local content, financing |
| Americas | USD 3–4B | 7–9% | Brackish (Texas, Chile), seawater (California) | 1,300–1,800 | State-level discharge permits |
| Europe | USD 2–3B | 6–8% | Seawater (Mediterranean), brackish (Spain, Cyprus) | 1,400–1,900 | EU BREF brine compliance |
For Chinese EPC contractors, the Saudi Arabia 2026 buyer guide and the Algeria 2026 buyer guide outline the local content and pre-qualification thresholds that gate access to the largest absolute market.
What 9.1% CAGR Means for Your 2026 Equipment Decision
The market signal converts into equipment decisions through three feed-water scenarios. If feed TDS is 500–5,000 mg/L (brackish), specify RO with ED concentrate polishing; expect 75–85% recovery without antiscalant breakthrough, and budget for a multi-media pretreatment protecting downstream RO membranes to control SDI below 3. If feed TDS is 35,000–45,000 mg/L (seawater), specify SWRO with an isobaric energy recovery device; target 95% recovery and 2.5–3.5 kWh/m³ specific energy consumption. If the project requires greater than 95% water recovery or zero liquid discharge, specify a hybrid RO + brine concentrator + crystallizer train, with submerged MBR pretreatment for ZLD hybrid systems delivering sub-1 μm effluent and 60% smaller footprint than conventional activated sludge (HydropureWater MBR spec).
The procurement reality for 2026: lead time on 8-inch RO pressure vessels is 12–18 weeks, and membrane element supply is back to 2024 tightness because of hyperscaler and lithium fab demand pulling the same DuPont and Toray production lines. Budget CAPEX against 2025 unit pricing, not projected 2030 deflation — the 6.4% ion exchange membrane CAGR signals input cost escalation, not relief, over the planning horizon.
Frequently Asked Questions
What is the desalination market growth rate in 2026?
The global desalination market is projected to grow from USD 20.76 billion in 2026 to USD 38.20 billion by 2033, at a 9.1% CAGR. A second syndicated dataset reports USD 17.76 billion in 2025 rising to USD 38.80 billion by 2034 at 9.07% CAGR. Both endpoints converge within 2%, and the CAGR difference is 0.03 percentage points.
Which desalination technology is growing fastest in 2026?
Seawater reverse osmosis (SWRO) holds the largest capacity share at 45–55% and is growing at 10–12% CAGR. Inside brackish water, electrodialysis reversal (EDR) is the fastest-growing sub-segment at 11–13% CAGR, driven by concentrate polishing applications where RO recovery is scaling-limited.
What is the typical CAPEX for an industrial desalination plant in 2026?
Industrial CAPEX benchmarks range from USD 900/m³/day in Asia-Pacific seawater plants to USD 1,900/m³/day in EU Mediterranean sites with BREF brine compliance. Industrial plants carry a 30–60% CAPEX premium over municipal tenders because of pretreatment complexity, higher recovery targets, and brine management requirements.
When should an industrial buyer specify ZLD over conventional SWRO?
Specify zero liquid discharge when feed TDS exceeds 45,000 mg/L, when site discharge permits prohibit brine outfall, or when water reuse above 95% is mandated. A hybrid RO + brine concentrator + crystallizer train with MBR pretreatment is the standard 2026 configuration for these constraints, with the MBR market forecast to 2030 projecting the pretreatment segment to grow at 9–10% CAGR on the back of ZLD adoption.
How long is the RO membrane lead time in 2026?
Lead time on 8-inch RO pressure vessels is 12–18 weeks, and membrane element supply has tightened to 2024 levels because of hyperscaler data center and lithium fab demand. Industrial buyers should budget CAPEX against 2025 unit pricing and add 4–6% annual escalation rather than assuming 2030 deflation.