What Is the Best Technology for Fluoride Removal in Industrial Wastewater?
No single unit operation is the best industrial answer. Streams above 100 mg/L F⁻ start with calcium precipitation to about 10–30 mg/L, then reverse osmosis or ion exchange polishes to below 1.5 mg/L for discharge or reuse. Activated alumina fits feeds below about 10 mg/L F⁻. Electrocoagulation stays niche for 5–50 mg/L flows with chemical-handling limits.
Industrial fluoride removal technologies must handle 50 mg/L to over 10,000 mg/L F⁻ with aluminum, silicon, and boron complexes that municipal plants rarely see. Semiconductor etching, photovoltaic texturing, glass works, steel pickling, aluminum smelting, and fertilizer plants drive those loads. Drinking-water sources in endemic areas usually sit below 5 mg/L, so municipal playbooks break once the matrix turns industrial.
Three gaps force a different design. A single calcium stage that cuts 500 mg/L F⁻ to 15 mg/L still needs polishing. Complexed fluoride under-shoots lime stoichiometry and raises reagent use. Reuse and zero-liquid-discharge targets often sit below 1 mg/L F⁻ — tighter than the WHO drinking-water guideline of 1.5 mg/L, China’s GB 8978-1996 discharge limit of 10 mg/L, or typical EU industrial bands of 10–30 mg/L.
The Five Industrial Fluoride Removal Technologies Compared
Five options dominate plant designs: calcium precipitation plus coagulation, reverse osmosis, ion exchange resin, activated alumina adsorption, and electrocoagulation with other emerging methods. Saltworks frames precipitation as the industrial path to meet discharge limits, while adsorption, ion exchange, and membranes fit low fluoride better. Drinking-water reviews often rank adsorption first; that ranking tracks municipal research volume, not high-throughput industrial duty.
Most sites we size run a two-stage train. Stage 1 drops high fluoride into the 10–30 mg/L band. Stage 2 then hits discharge or reuse. The matrix below shows roles; later sections cover chemistry, waste, and cost.
| Technology | Primary Role | Best Influent (mg/L F⁻) | Typical Effluent (mg/L F⁻) |
|---|---|---|---|
| Calcium precipitation + coagulation | Stage 1 (bulk removal) | >100 | 10–30 |
| Reverse osmosis | Stage 2 (polishing) | <50 | <0.5 |
| Ion exchange resin | Stage 2 (polishing) | 5–30 | <0.5 |
| Activated alumina adsorption | Stage 2 or low-strength standalone | <10 | <1.0 |
| Electrocoagulation / emerging | Niche or pilot | 5–50 | 1–5 |
How Does Chemical Precipitation Remove Fluoride and Manage Sludge?

Calcium precipitation is the default Stage 1 above 100 mg/L F⁻ because reagent cost, throughput, and operator familiarity beat membranes or adsorbents at that load. Lime (Ca(OH)₂) or calcium chloride is dosed in a pH-controlled reactor, and fluoride forms CaF₂ with Ksp ≈ 1.5 × 10⁻¹⁰. Stoichiometry needs about 2.2–2.5 kg Ca(OH)₂ per kg F⁻ removed once excess for 15–20 mg/L equilibrium is counted, and dry CaF₂ sludge runs 4–8 kg per kg F⁻. Single-stage effluent reliably lands at 10–30 mg/L F⁻; below 10 mg/L without seeding or a second stage is rare.
Hold pH in the 9–11 window or removal collapses. Co-precipitation of calcium phosphate, aluminum hydroxide, and magnesium hydroxide steals lime, so dose tracks the matrix. Most plants landfill the sludge, though tighter waste rules push filter-press dewatering and flux reuse. Pairing an automatic chemical dosing system with a high-efficiency lamella clarifier keeps stoichiometry inside the narrow band precipitation needs. Ceramic microfiltration can replace clarifier-plus-sand trains when footprint and solids capture matter for downstream RO.
| Parameter | Typical Value |
|---|---|
| Reagent | Ca(OH)₂ (lime) or CaCl₂ |
| Dose | 2.2–2.5 kg Ca(OH)₂ per kg F⁻ removed |
| pH window | 9–11 |
| Single-stage effluent | 10–30 mg/L F⁻ |
| Sludge generation | 4–8 kg dry CaF₂ per kg F⁻ |
| Precipitation constant Ksp | ≈ 1.5 × 10⁻¹⁰ |
Reverse Osmosis for Fluoride Polishing and Reuse
Reverse osmosis is the Stage 2 of choice when reuse-quality water or sub-1.5 mg/L effluent is required. Brackish-water RO membranes reject F⁻ at greater than 99%, and seawater RO is tighter still, with industrial permeate often below 0.2–0.5 mg/L F⁻.At industrial scale RO polishes; it is not a stand-alone bulk remover because of the concentrate it creates.
Feed fluoride should stay below 50 mg/L and turbidity below 2 NTU, so RO almost always follows precipitation and filtration. Recovery of 70–85% permeate leaves 15–30% concentrate loaded with fluoride, hardness, and silica. That brine either returns to the precipitation reactor or goes to crystallization on ZLD sites. For a 50 m³/h train, an industrial RO system in the 10–500 m³/day envelope is typical. Favor ion exchange when concentrate disposal is constrained; favor RO when a brine path exists.
| Parameter | Typical Value |
|---|---|
| F⁻ rejection | >99% (BWRO), tighter for SWRO |
| Effluent F⁻ | <0.2–0.5 mg/L |
| Feed F⁻ requirement | <50 mg/L |
| Feed turbidity requirement | <2 NTU |
| Recovery rate | 70–85% |
| Concentrate disposal | Recycle to Stage 1 or crystallize |
Ion Exchange Resin: When Low-Fluoride Effluent Is the Priority
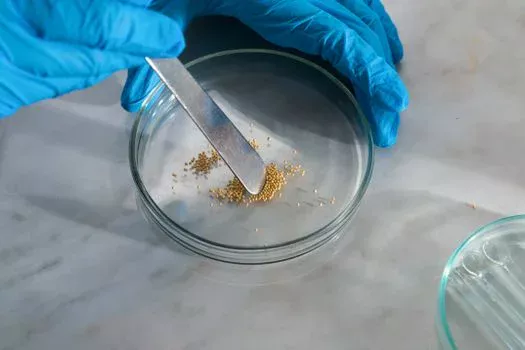
Ion exchange fits Stage 2 when feed fluoride is already low, flow is modest, and RO concentrate disposal is costly or restricted. Strong-base anion resins selective for fluoride and aluminum-loaded chelating resins are the workhorses. Single-pass effluent lands below 0.5 mg/L F⁻, with breakthrough capacities about 0.5–1.5 kg F⁻ per m³ resin before regeneration. Regeneration uses 4–8% NaOH or AlCl₃ brine; spent regenerant usually returns to the precipitation reactor so the mass balance stays closed.
Best duty is 5–30 mg/L F⁻ at flows below about 50 m³/h, where the lack of a concentrate stream decides the bid. Suspended solids and competing sulfate or phosphate foul or displace fluoride, so multimedia filtration upstream is non-negotiable. Regeneration chemicals often take 60–70% of lifetime cost. Intermittent or swinging inlet chemistry favors resin over RO because the bed buffers spikes that would force an RO skid to throttle.
Activated Alumina and Other Adsorbents
Activated alumina is the U.S. EPA Best Available Technology for fluoride removal in drinking water, as reflected in the 2014 USEPA activated-alumina design manual used across municipal projects. The window is narrow for industry: inlet F⁻ below 10 mg/L and pH acid-adjusted to 5.5–6.0. According to WHO Guidelines for drinking-water quality (2022), about 1 mg/L should be achievable with activated alumina under drinking-water conditions. Adsorption capacity runs 1–5 mg F⁻ per gram media, with breakthrough after 200–400 bed volumes. Regeneration with 1–2% NaOH plus acid re-conditioning restores capacity, but 5–10% of media is typically lost each cycle.
Bone char, iron-modified carbon, lanthanum-impregnated alumina, and metal-organic frameworks remain research or pilot options. None yet match the flows most industrial buyers need as a default specification.
Electrocoagulation and Emerging Methods
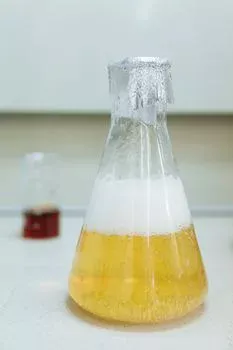
Electrocoagulation uses aluminum or iron anodes to generate coagulant in situ and can treat 5–50 mg/L F⁻ with less bulk chemical handling than lime. Power use of about 1–3 kWh/m³ becomes a major OPEX line at high flow. Electrode passivation and limited track record above 100 m³/h keep it niche. Fluidized-bed crystallization grows CaF₂ pellets that can sell as metallurgical flux, but commercial installs remain few. Nanofiltration and electrodialysis appear in reviews as evaluate-for-constraint tools, not Stage 1 defaults.
How Should Engineers Evaluate Fluoride Removal Options?
Engineers evaluating fluoride removal options should lock two numbers first: influent F⁻ and the discharge or reuse target. If influent exceeds 100 mg/L F⁻, start with calcium precipitation. If the target sits below 1.5 mg/L F⁻, add RO or ion exchange as Stage 2. Activated alumina is the default for low-strength polishing. Electrocoagulation fits chemical-handling limits or small flows. Score each option on sludge or brine path, competing ions, recovery or regeneration chemicals, and whether concentrate recycle closes the fluoride mass balance.
| Technology | Best Influent (mg/L F⁻) | Typical Effluent (mg/L F⁻) | Sludge / Waste | CAPEX Signal | OPEX Driver | Industrial Fit |
|---|---|---|---|---|---|---|
| Calcium precipitation + coagulation | >100 | 10–30 | 4–8 kg CaF₂ per kg F⁻ | Low–moderate | Lime, sludge disposal | Default Stage 1 |
| Reverse osmosis | <50 | <0.5 | Concentrate 15–30% of feed | Moderate–high | Membranes, energy | Default Stage 2 for reuse |
| Ion exchange resin | 5–30 | <0.5 | Spent brine (recyclable) | Moderate | NaOH / AlCl₃ regenerant | Stage 2 when RO concentrate constrained |
| Activated alumina | <10 | <1.0 | Spent media (5–10%/cycle) | Low | Acid, NaOH, media replacement | Polishing or low-strength standalone |
| Electrocoagulation / emerging | 5–50 | 1–5 | Metal hydroxide sludge | Moderate | Electricity, electrodes | Niche or pilot |
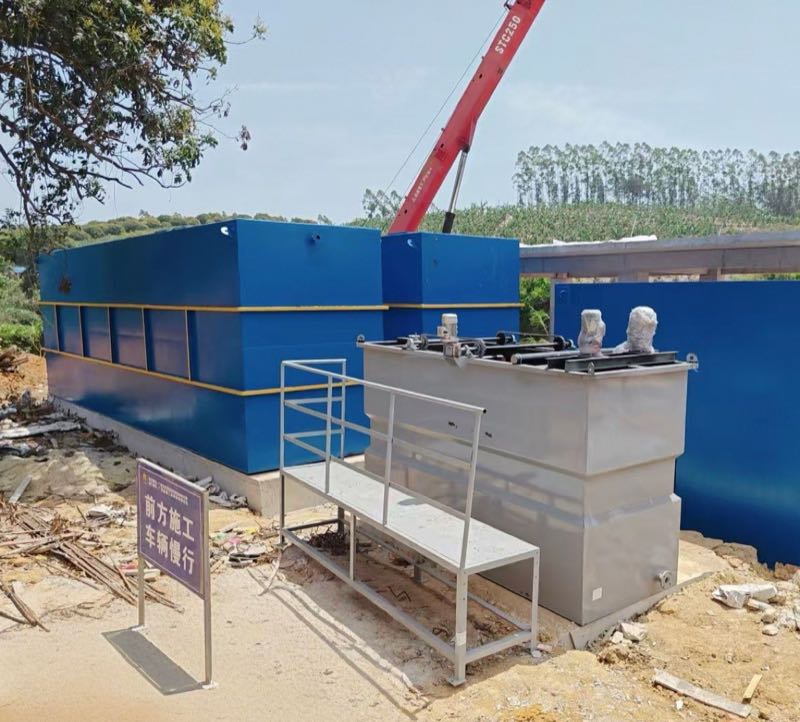
For Stage 1 trains, a multi-media filter after the clarifier protects RO and resin from solids, and an integrated water purification skid packages dosing, clarification, filtration, and polishing for faster install.
Designing a Two-Stage Treatment Train
The engineering job is sequencing so each stage sees a feed it can handle. The standard train is lime precipitation → lamella sedimentation or DAF clarification → sand or multimedia filtration → RO or ion exchange → optional mixed-bed polish. A Dissolved Air Flotation (DAF) System replaces conventional clarification when suspended solids or emulsified oils are high, which is common in glass and photovoltaic wastewater. A plate-frame filter press dewaters CaF₂ sludge to a handleable cake for disposal or flux resale.
Semiconductor trains often run precipitation → ceramic membrane → RO → electrodialysis metathesis to recover HF for fab reuse. Glass and photovoltaic plants frequently use precipitation → sand filter → activated alumina → RO with permeate closing an HF loop. Aluminum smelters use two-stage precipitation (primary at pH 9, secondary with seed) then RO, and sell cleaned CaF₂ as flux. Recycle RO concentrate to precipitation when possible: it cuts lime use and shrinks brine to crystallizers. Most plants we size for mid-flow industrial duty run at the lower end of recovery until silica and fluoride mass balance stabilize.
Which Discharge Limits Apply to Fluoride in the EU?
EU industrial fluoride limits under Industrial Emissions Directive 2010/75/EU typically fall in the 10–30 mg/L band by sector, so many plants still need Stage 2 polishing when reuse or local permits tighten further. China’s GB 8978-1996 sets 10 mg/L for industrial discharge, while GB/T 19923-2005 reuse water asks for 1.0 mg/L. The United States keeps a 4.0 mg/L MCL for drinking water under the EPA; industrial NPDES permits are state-specific and commonly 10–35 mg/L. India’s CPCB effluent standards typically run 2–10 mg/L by industry. Reuse and ZLD targets below 1 mg/L drive polishing more often than discharge tables alone.
| Region | Standard | F⁻ Limit (mg/L) |
|---|---|---|
| China — discharge | GB 8978-1996 | 10 |
| China — reuse | GB/T 19923-2005 | 1.0 |
| European Union | IED 2010/75/EU | 10–30 (sector-dependent) |
| United States — drinking water | EPA MCL | 4.0 |
| United States — industrial | NPDES (state-specific) | 10–35 |
| India | CPCB effluent standards | 2–10 (industry-dependent) |
| WHO — drinking water guideline | — | 1.5 |
CAPEX and OPEX: What to Budget
Order-of-magnitude CAPEX for a 50 m³/h precipitation-plus-RO train runs USD 400,000–1,200,000. Materials of construction, automation, and concentrate handling set the spread. OPEX is dominated by lime at roughly USD 50–150 per m³ treated, RO membrane replacement on a 3–5 year cycle, and CaF₂ sludge disposal. Activated-alumina-only systems carry lower CAPEX but higher chemical and media OPEX. Ion exchange OPEX is dominated by NaOH regenerant, which is why resin wins when RO brine disposal is constrained.
The strongest cost levers are recycling RO concentrate to precipitation, selling CaF₂ as metallurgical flux, and recovering HF from acidic upstream streams. Regional cost context across full industrial wastewater trains is covered in our industrial wastewater treatment cost benchmarks analysis. Disinfection downstream of fluoride polishing for reuse is covered in our industrial disinfection system selection guide.
| Train Configuration | Flow Range | CAPEX (USD) | OPEX Driver |
|---|---|---|---|
| Precipitation + RO (two-stage) | 50 m³/h | 400K–1.2M | Lime, membranes, sludge disposal |
| Activated alumina standalone | 10–50 m³/h | 100K–300K | Acid, NaOH, media replacement |
| Ion exchange polishing | 10–50 m³/h | 150K–400K | NaOH / AlCl₃ regenerant |
Selection Checklist, Audience, and Next Step
Use this short checklist before freezing the P&ID: (1) measure free versus total fluoride and key complexing metals; (2) confirm discharge versus reuse target in mg/L; (3) decide Stage 1 precipitation when influent exceeds 100 mg/L F⁻; (4) choose RO versus ion exchange from concentrate disposal constraints; (5) size sludge dewatering and brine recycle; (6) verify pH, turbidity, and competing anion pretreatment; (7) pilot if silica, boron, or aluminum complexes dominate.
This page is for plant engineers, EPC process leads, and procurement teams sizing industrial fluoride trains. Buyers chasing only point-of-use drinking-water cartridges should look at municipal activated-alumina or RO guides instead. If you already have influent data and a permit limit, share them through our fluoride treatment inquiry form so the Stage 1/Stage 2 envelope can be checked against your matrix — including whether a second Dissolved Air Flotation (DAF) System pass is warranted for oily solids.
Frequently Asked Questions
What is the best technology for fluoride removal in industrial wastewater?
There is no single best unit. The practical answer is a two-stage train: calcium precipitation for influent above 100 mg/L F⁻ to reach about 10–30 mg/L, then reverse osmosis or ion exchange to land below 1.5 mg/L for discharge or reuse. Activated alumina polishes feeds below about 10 mg/L F⁻. Electrocoagulation stays a niche option for smaller flows with chemical-handling limits.
Can reverse osmosis remove 100% of fluoride?
RO does not remove 100% of fluoride. Brackish-water membranes typically reject greater than 99% of F⁻ and produce permeate below 0.2–0.5 mg/L. The remaining 15–30% of feed leaves as concentrate that retains rejected fluoride and must be recycled to precipitation or crystallized.
Is activated alumina still the best available technology?
Activated alumina remains the U.S. EPA Best Available Technology for fluoride removal in drinking water, consistent with the 2014 USEPA design manual. WHO Guidelines for drinking-water quality (2022) note about 1 mg/L is achievable with activated alumina. In industrial service it is a polishing stage for streams below 10 mg/L F⁻, not a primary high-load step.
What fluoride concentration can calcium precipitation achieve?
Single-stage calcium precipitation typically achieves 10–30 mg/L F⁻ effluent at pH 9–11. Reaching below 10 mg/L needs a second seeded precipitation stage or polishing with RO, ion exchange, or activated alumina. Sludge generation commonly runs 4–8 kg dry CaF₂ per kg F⁻ removed.
How much does an industrial fluoride removal system cost?
A 50 m³/h two-stage precipitation-plus-RO train typically costs USD 400,000–1,200,000 in CAPEX. OPEX is dominated by lime at about USD 50–150 per m³ treated, RO membrane replacement every 3–5 years, and CaF₂ sludge disposal. Activated-alumina and ion-exchange packages carry lower CAPEX with different chemical OPEX profiles.