Why Brewery Wastewater Is Hard to Treat in 2026
Brewery effluent carries 2,000–6,000 mg/L of COD, 1,200–3,500 mg/L of BOD, and 200–1,500 mg/L of TSS — concentrations that exceed domestic sewage by a factor of 5–10 and that trigger municipal surcharges the moment a brewery exceeds its allocation. Water-to-beer ratios of 3:1 to 7:1 mean a 50,000 hL/year craft brewery discharges roughly 15–35 m³/day, while a 1 million hL/year commercial site can push 300–700 m³/day through the same downstream pipe (Brewers Association water-use benchmarks, 2025-11).
The load does not arrive uniformly. Brew-house rinse peaks during mashing and sparging; CIP (clean-in-place) caustic and acid cycles swing pH from 3 to 12 within a single shift; fermentation off-gas condensates arrive warm (30–40°C) and sugary; bottling and keg wash contribute label fines, glass fragments, and dilute caustic. The combination of high organic strength, high temperature, and pH excursions is what separates brewery influent from a typical food-and-beverage stream and why packaged domestic-grade treatment packages fail.
Discharging this stream untreated risks BOD shock at the receiving municipal plant, ammonia toxicity from CIP nitrogen, eutrophication downstream, and forfeited reuse revenue. A 2026 reuse loop returning 60–70% of treated effluent to cleaning and boiler feed at industrial water rates of $3–$8/m³ (US/EU) typically pays back the on-site plant in 2–4 years.
Brewery Wastewater Treatment Process Flow (2026 Design)
A modern 2026 brewery process train runs in six stages, each with a defined hydraulic and removal role. Skipping any stage is what produces the chronic non-compliance that craft brewers report when they scale a "good enough" package plant to production volumes.
- Screening — a rotary mechanical bar screen with 3–6 mm aperture removes grain, hops, labels, and glass fragments before they reach the pump gallery.
- Equalization — an 8–24 hour HRT buffer basin dampens BOD and pH spikes from batch brewing and CIP cycles.
- DAF — a dissolved air flotation system rated at 4–25 m³/h per unit lifts suspended solids and FOG.
- Biological treatment — high-rate anaerobic (UASB/IC) for flows above 20 m³/day, or extended-aerobic activated sludge for smaller sites.
- MBR polishing — an MBR membrane bioreactor with submerged PVDF flat sheet MBR module stacks delivers the final effluent quality.
- Disinfection & reuse — a chlorine dioxide generator provides residual control for in-plant reuse loops.
Sludge from the DAF float and waste activated sludge is dewatered on a plate-and-frame filter press to 22–28% dry solids for off-site disposal or composting. For a deeper view of how MBR integrates with beverage streams, the beverage wastewater MBR solution guide walks through a 2026 reference design.
| Stage | Equipment | Design Parameter | Typical Removal / Output |
|---|---|---|---|
| 1. Screening | Rotary bar screen (3–6 mm) | Peak instantaneous flow | Removes >70% of gross solids |
| 2. Equalization | EQ basin, mixed/aerated | 8–24 h HRT | Dampens BOD, pH 3–12 → 6–9 |
| 3. DAF | DAF unit, 4–25 m³/h | 25–35% recycle, 5–10 min retention | 80–95% TSS, 50–70% FOG, 30–50% COD |
| 4a. Anaerobic | UASB / IC reactor | HRT 6–24 h, 35–37°C | 75–90% COD; ~0.35 m³ biogas/kg COD removed |
| 4b. Aerobic | Activated sludge / SBR | SRT 15–30 d, MLSS 3,000–5,000 mg/L | 85–95% BOD, 80–90% COD |
| 5. MBR | Submerged PVDF, <1 µm | Flux 15–25 L/m²·h | BOD ≤20, COD ≤50, TSS ≤10 mg/L |
| 6. Disinfection | ClO₂ generator | 0.2–1.0 mg/L residual | <10 CFU/100 mL fecal coliform |
| Sludge | Plate-and-frame press | 8–12 bar, 2–4 h cycle | Cake 22–28% DS |
Comparing Aerobic, Anaerobic, and MBR Routes
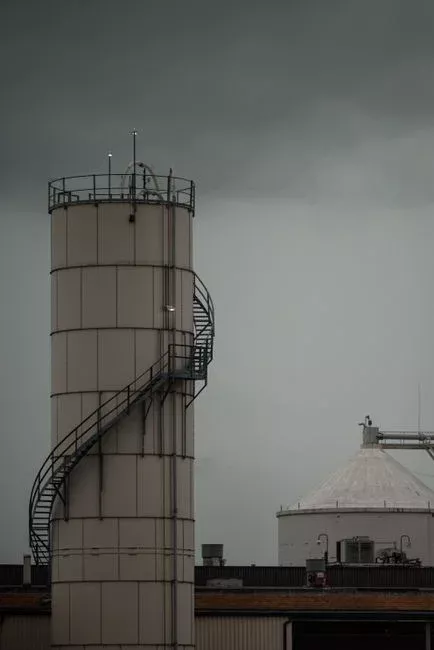
Selection between biological routes is driven by flow scale, discharge target, and whether biogas revenue or water reuse enters the business case. Anaerobic digestion in a UASB or IC reactor fits flows above 20 m³/day and COD above 2,000 mg/L; it removes 75–90% of COD and yields roughly 0.35 m³ of biogas per kg of COD destroyed, but it cannot meet a sub-20 mg/L BOD effluent on its own. Conventional activated sludge is mature and forgiving, yet it needs a large footprint, a clarifier, and a tertiary step to reliably clear a 20 mg/L BOD limit. The MBR route — aerobic biology coupled with a submerged membrane — delivers the smallest footprint and the cleanest effluent, and it tolerates the BOD swings that come with batch brewing.
For sites under 20 m³/day, a sequencing batch reactor (SBR) is often the most cost-effective compromise: one tank, flexible cycle timing, no separate clarifier. The 2026 decision is rarely "anaerobic or aerobic" — it is "which biology, plus which polishing step, plus which reuse polish". For a longer view of where MBR is heading, the MBR market forecast to 2030 sizes the industrial pipeline.
| Route | Best Flow Range | BOD Out (mg/L) | COD Out (mg/L) | Footprint | Energy (kWh/m³) | OPEX (USD/m³) | CAPEX Tier |
|---|---|---|---|---|---|---|---|
| Anaerobic (UASB/IC) + MBR | >20 m³/d, COD >2,000 mg/L | ≤20 | ≤50 | Small | 0.3–0.6 (net of biogas) | 0.25–0.55 | High (mid–large) |
| Conventional activated sludge + clarifier | Any | 20–30 | 80–120 | Large | 0.6–1.0 | 0.45–0.75 | Medium |
| SBR + cloth filter | 5–50 m³/d | ≤25 | ≤80 | Medium | 0.5–0.8 | 0.5–0.85 | Medium |
| MBR (aerobic + submerged membrane) | 5–500 m³/d | ≤10 | ≤30 | Smallest | 0.8–1.2 | 0.6–1.2 | Medium–High |
Craft Brewery vs. Commercial Brewery: Equipment Sizing & Costs
Cost benchmarking in 2026 separates cleanly into three tiers. A craft brewery producing 5–20 m³/day of wastewater typically deploys a packaged DAF + MBR skid; CAPEX lands at roughly $80,000–$250,000 and OPEX at $0.6–$1.2/m³ (HydropureWater field data, 2026). The mid-size band (20–100 m³/day) installs a DAF + anaerobic + MBR combination at $300,000–$900,000 CAPEX and $0.4–$0.8/m³ OPEX. A commercial brewery above 100 m³/day running a full train with biogas utilization and RO reuse sees CAPEX of $1.2M–$4M and OPEX of $0.25–$0.55/m³ once the reuse credit is netted.
Payback on a reuse loop is 2–4 years at 2026 industrial water rates of $3–$8/m³ across most US and EU markets, provided the brewery displaces at least 60% of its incoming water. If your plant is generating more than 30 m³/day of wastewater, sizing the membrane surface area and the chemical-cleaning regime correctly is where most of the lifecycle cost lives — the ultrafiltration system cost guide walks through the 2026 numbers, and the sludge dewatering cost strategies post covers the back end.
| Tier | Flow (m³/d) | Configuration | Footprint (m²) | CAPEX (USD) | OPEX (USD/m³) | Reuse-Ready |
|---|---|---|---|---|---|---|
| Craft | 5–20 | DAF + MBR skid | 15–30 | 80K–250K | 0.6–1.2 | No (sewer) |
| Mid-size | 20–100 | DAF + Anaerobic + MBR | 40–90 | 300K–900K | 0.4–0.8 | Optional |
| Commercial | >100 | Full train + biogas + RO | 120–300 | 1.2M–4M | 0.25–0.55 (with reuse offset) | Yes |
2026 Discharge Limits, Reuse Targets & Compliance Checklist
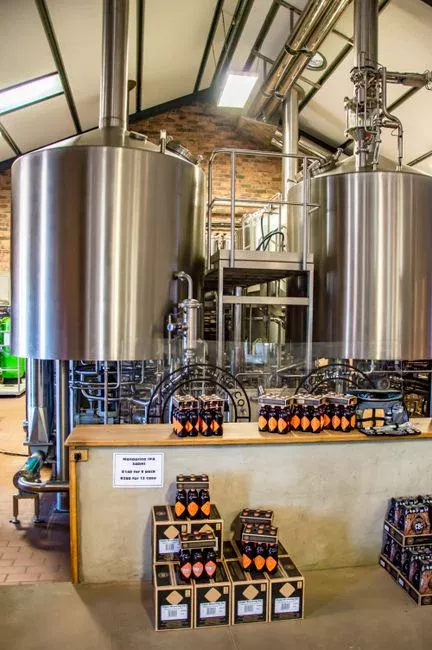
Most municipal pretreatment programs in 2026 enforce a sewer discharge envelope of BOD <30 mg/L, COD <125 mg/L, TSS <30 mg/L, and pH 6–9, with ammonia, FOG, and total phosphorus limits set locally (per EPA 40 CFR 133 General Pretreatment standards and EU UWWTD 91/271/EEC, as transposed by member states). Reuse-grade targets for in-plant cleaning or boiler feed tighten to BOD <10 mg/L, COD <30 mg/L, conductivity <50 µS/cm where RO polish is applied, plus a 1-NTU turbidity ceiling.
Online instrumentation should at minimum cover ammonia, COD, and TSS at the biological effluent; membrane-integrity and turbidity meters are added when the plant runs an MBR or RO loop. Reporting cadence is typically monthly for self-monitoring and quarterly for the discharge compliance report.
| Parameter | Sewer Discharge (2026) | Reuse (Cleaning / Boiler) | Monitoring |
|---|---|---|---|
| BOD₅ | <30 mg/L | <10 mg/L | Online BOD sensor or 5-day lab |
| COD | <125 mg/L | <30 mg/L | Online COD, weekly lab check |
| TSS | <30 mg/L | <5 mg/L | Online TSS probe |
| pH | 6–9 | 6.5–8.5 | Continuous pH meter |
| Ammonia-N | <10–30 mg/L (regional) | <2 mg/L | Online NH₃-N |
| FOG | <100 mg/L (regional) | <10 mg/L | Periodic lab |
| Conductivity | — | <50 µS/cm (RO polish) | Inline meter |
How to Choose the Right Brewery Wastewater System in 2026
Match the system to four site-specific answers before you talk to vendors: (1) average and peak daily flow in m³/day, (2) peak COD and BOD in mg/L, (3) whether the final destination is the municipal sewer or a reuse loop, and (4) the available footprint. If you are a small craft brewer (<20 m³/day) with sewer discharge and limited land, a packaged underground integrated sewage treatment unit sized with the supplier's automatic chemical dosing system is usually the shortest path to compliance. If you need better TSS and FOG removal upstream, a high-efficiency sedimentation tank can replace or supplement DAF at smaller flows. For a commercial site with reuse targets, the answer is the full train: DAF + anaerobic + MBR + RO, with biogas utilization and on-line nutrient monitoring.
Frequently Asked Questions
What is the typical COD and BOD of brewery wastewater? Raw brewery influent typically runs 2,000–6,000 mg/L COD and 1,200–3,500 mg/L BOD, with TSS in the 200–1,500 mg/L band and pH excursions between 3 and 12 across a brewing week (Brewers Association wastewater benchmarks, 2025-11).
Can a brewery treat its own wastewater for water reuse? Yes — a 2026 DAF + anaerobic + MBR + RO train typically returns 60–75% of treated effluent to cleaning and boiler feed at conductivity under 50 µS/cm, paying back the capital cost in 2–4 years at industrial water rates of $3–$8/m³.
Is anaerobic (UASB) treatment suitable for a craft brewery? Anaerobic UASB or IC reactors are economic above roughly 20 m³/day and influent COD above 2,000 mg/L; below that, the heat-up energy penalty tends to outweigh the biogas benefit and a packaged aerobic MBR is the better fit.
How much does a brewery wastewater treatment plant cost in 2026? CAPEX ranges from $80,000–$250,000 for a craft DAF + MBR skid, $300,000–$900,000 for a mid-size DAF + anaerobic + MBR combination, and $1.2M–$4M for a commercial full train with biogas utilization and RO reuse (HydropureWater field data, 2026).
What discharge limits apply to brewery effluent in 2026? Most US municipal pretreatment programs enforce BOD <30 mg/L, COD <125 mg/L, TSS <30 mg/L, and pH 6–9 (per EPA 40 CFR 133); EU sites follow the limits transposed from UWWTD 91/271/EEC, which are typically similar but vary by member state and receiving-water sensitivity.