Solvent Wastewater Treatment by Advanced Oxidation: 2026 Engineering Specs & Compliance Blueprint
Solvent advanced oxidation processes (AOPs) degrade persistent organics such as TMAH, IPA, and acetone by generating hydroxyl radicals (·OH) with an oxidation potential of 2.8 V, higher than ozone (2.1 V) or chlorine (1.4 V). In 2026, AOPs for solvent streams achieve 92–97% COD removal at influent concentrations of 50–500 mg/L. UV/H₂O₂ systems draw 0.5–2.0 kWh/m³ while Fenton consumes 0.3–0.8 kg H₂O₂ per kg COD treated. Metal finishing plants under EPA 40 CFR Part 433 and EU installations under Directive 2010/75/EU can meet BAT or categorical limits with reactor retention times of 30–120 minutes, depending on solvent type and selected AOP technology.
Why Solvent Wastewater Fails Conventional Treatment
Solvents such as tetramethylammonium hydroxide (TMAH), isopropyl alcohol (IPA), and acetone resist biological treatment because their BOD/COD ratio typically sits below 0.2 and their inherent toxicity disrupts microbial populations. Conventional activated sludge or dissolved air flotation (DAF) units only achieve 30–60% COD removal on these streams, which often leaves plants short of discharge permits. Earlier drafts cited a 1 mg/L TMAH cap under 40 CFR Part 433; that part sets metal finishing limits and a 2.13 mg/L daily-maximum TTO standard, not a TMAH numeric limit. One semiconductor fab in Suzhou accumulated ¥2.1 million in TMAH exceedance fines over a single year before switching to AOPs (HydropureWater field data, 2025). AOPs solve this by producing hydroxyl radicals that mineralize solvents non-selectively into CO₂, H₂O, and inorganic ions at reaction rates 10³–10⁹ times faster than ozone or chlorine alone.
How Advanced Oxidation Processes Work: Mechanisms and Radical Chemistry
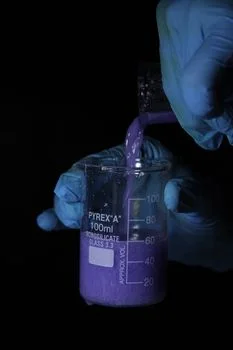
Advanced oxidation processes (AOPs) are chemical treatment routes that use highly reactive species—primarily hydroxyl radicals (·OH), plus ozone (O₃) and sulfate radicals (SO₄·⁻)—to oxidize organic and inorganic contaminants in water. The non-selective attack mechanism is what lets AOPs mineralize recalcitrant solvents that survive biological or physical treatment.
Three generation pathways dominate field practice. UV photolysis splits hydrogen peroxide under UV-C light (λ < 300 nm): H₂O₂ + UV → 2·OH. Fenton's reagent relies on ferrous iron catalysis: Fe²⁺ + H₂O₂ → ·OH + Fe³⁺ + OH⁻. Catalytic ozonation uses ozone reacting with metal oxides or activated carbon to seed ·OH formation. Hydroxyl radicals react with solvents at diffusion-controlled rates of 10⁹–10¹⁰ M⁻¹s⁻¹, meaning nearly every collision yields a reaction. Field efficiency, however, drops sharply when bicarbonate, natural organic matter, or chloride scavenges the radicals before they reach the target pollutant. TMAH, for example, oxidizes stepwise through intermediates before mineralizing fully to NH₄⁺ and CO₂.
Engineers sizing AOP reactors track four core parameters: oxidant dose (mg/L or kg/kg COD), energy input (kWh/m³ for UV or ozone), reactor retention time (minutes), and pH window—which ranges from 3–4 for Fenton to 7–9 for catalytic ozonation or UV/H₂O₂. Most plants we size for pharma and electronics run at the lower end of the oxidant dose range because influent variability is modest and online COD trim controls the rest.
| Parameter | Description for AOPs | Typical Range (Solvent Wastewater) |
|---|---|---|
| Oxidant Dose | Concentration of H₂O₂, O₃, or persulfate required to achieve target COD removal. | H₂O₂: 1.5–3.0 × COD (mg/L); O₃: 1.0–2.0 × COD (mg/L) |
| Energy Input | Electrical energy consumed for UV lamps or ozone generators per volume of treated water. | UV/H₂O₂: 0.5–2.0 kWh/m³; Catalytic Ozonation: 0.3–0.8 kWh/m³ |
| Reactor Retention Time | Average time wastewater spends in the reactor for sufficient radical exposure. | 15–60 minutes (depending on AOP and solvent load) |
| pH Range | Optimal pH for radical generation and reaction efficiency. | Fenton: 3–4; UV/H₂O₂: 5–9; Catalytic Ozonation: 6–8 |
| COD Removal Efficiency | Percentage reduction in chemical oxygen demand. | 92–97% for influent 50–500 mg/L COD |
AOP Technology Comparison: UV/H₂O₂ vs. Fenton vs. Catalytic Ozonation
Selecting the right advanced oxidation process for solvent wastewater means weighing COD removal, energy draw, sludge output, and CapEx side by side. UV/H₂O₂ suits high-purity pharma and electronics lines, delivering 90–95% COD removal with negligible sludge but pulling 1.0–2.5 kWh/m³ and demanding influent turbidity below 5 NTU to protect UV lamps.
Fenton oxidation carries the lowest CapEx—¥500K–¥1.2M for a 10 m³/h unit—and reaches 88–93% COD removal. The trade-off is iron sludge at 0.1–0.3 kg per kg COD removed, plus a tight 3–4 pH window that drives acid and caustic dosing before and after the reactor. Catalytic ozonation sits at 92–97% COD removal on 0.3–0.8 kWh/m³, runs near neutral pH, and produces minimal sludge, but catalyst replacement at 1–3 year intervals runs ¥200K–¥500K per year. For accurate reagent control, an automatic chemical dosing system keeps oxidant delivery on setpoint.
Match technology to context. UV/H₂O₂ fits low-flow, high-purity trains where any sludge is unacceptable. Fenton suits budget-driven sites with strong solids handling. Catalytic ozonation is the default for high-flow, variable-load systems that need energy efficiency and neutral pH. Residual oxidant polishing often pairs with chlorine dioxide (ClO₂) generators for quenching downstream of the AOP reactor, or with an Ozone Generator & Water Tank Sterilization System for closed-loop polishing loops.
| Feature | UV/H₂O₂ | Fenton Oxidation | Catalytic Ozonation |
|---|---|---|---|
| COD Removal Efficiency | 90–95% | 88–93% | 92–97% |
| Oxidant Dose (H₂O₂/O₃) | 1.5–3.0 × COD (H₂O₂) | 1.5–3.0 × COD (H₂O₂) | 1.0–2.0 × COD (O₃) |
| Energy Consumption | 1.0–2.5 kWh/m³ | 0.1–0.3 kWh/m³ (mixing only) | 0.3–0.8 kWh/m³ (ozone generation) |
| Optimal pH Range | 5–9 | 3–4 | 6–8 |
| Sludge Generation | Minimal | High (0.1–0.3 kg/kg COD) | Minimal |
| CapEx (10 m³/h, 2026) | ¥1.2M–¥3.0M | ¥500K–¥1.2M | ¥1.5M–¥3.5M |
| OPEX (per m³) | ¥8–¥15 | ¥5–¥10 | ¥6–¥12 |
| Scalability (m³/h) | 1–100 | 1–200 | 1–300+ |
Engineering Specs: Reactor Design, Retention Time, and Oxidant Dosing
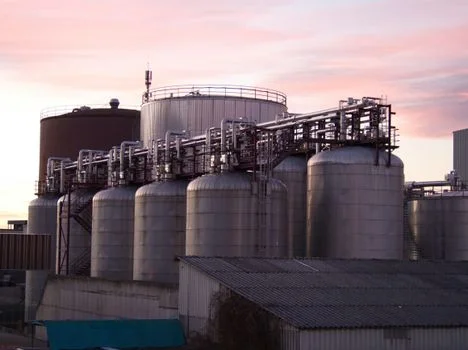
Reactor geometry follows the chemistry. Continuous-flow stirred-tank reactors (CSTRs) handle Fenton oxidation because they keep Fe²⁺ and H₂O₂ in close contact. Plug-flow reactors (PFRs) suit UV/H₂O₂ because uniform axial UV exposure cuts short-circuiting. Packed-bed reactors carry catalytic ozonation so gas, liquid, and catalyst meet efficiently. Typical retention times are 30–60 minutes for UV/H₂O₂, 15–30 minutes for Fenton, and 20–40 minutes for catalytic ozonation, each scaled against influent COD and target removal.
Oxidant dosing for UV/H₂O₂ and Fenton runs H₂O₂ at 1.5–3.0 × influent COD (mg/L); Fenton additionally needs Fe²⁺ at 0.1–0.3 × H₂O₂ dose. Catalytic ozonation runs O₃ at 1.0–2.0 × influent COD. Energy demand breaks down to 0.5–2.0 kWh/m³ for UV lamps, 0.1–0.3 kWh/m³ for Fenton mixing, and 0.3–0.8 kWh/m³ for ozone generation. Solvent-specific adjustments matter: TMAH's quaternary ammonium structure needs 20–30% higher oxidant doses than IPA or acetone at the same target removal.
Post-treatment closes the loop. AOPs leave residual H₂O₂ or O₃ that must be quenched—typically with sodium bisulfite—or polished through activated carbon, reverse osmosis (RO) systems, or multi-media filters for sites targeting water reuse.
| Design Parameter | UV/H₂O₂ System | Fenton Oxidation System | Catalytic Ozonation System |
|---|---|---|---|
| Reactor Type | Plug-Flow Reactor (PFR) | Continuous-Flow Stirred-Tank Reactor (CSTR) | Packed-Bed Reactor |
| Typical Retention Time | 30–60 minutes | 15–30 minutes | 20–40 minutes |
| H₂O₂ Dose (mg/L) | 1.5–3.0 × COD | 1.5–3.0 × COD | N/A (Ozone-based) |
| Fe²⁺ Dose (mg/L) | N/A | 0.1–0.3 × H₂O₂ dose | N/A (Catalyst-based) |
| O₃ Dose (mg/L) | N/A | N/A | 1.0–2.0 × COD |
| Energy Input (kWh/m³) | 0.5–2.0 (UV lamps) | 0.1–0.3 (Mixing) | 0.3–0.8 (Ozone generation) |
| TMAH Oxidant Factor | 1.2–1.3 × base dose | 1.2–1.3 × base dose | 1.2–1.3 × base dose |
Cost Models for AOP Systems: CapEx, OPEX, and ROI
Capital expenditure for a 10 m³/h AOP unit in 2026 spans ¥500K to ¥3.5M. UV/H₂O₂ systems land at ¥1.2M–¥3.0M, driven by UV reactor and power supply cost. Fenton is the cheapest entry at ¥500K–¥1.2M. Catalytic ozonation—including ozone generator and catalyst beds—sits at ¥1.5M–¥3.5M. These figures cover the reactor, dosing skids, and PLC controls.
Operational expenditure scales with utilities and consumables. UV/H₂O₂ runs ¥8–¥15/m³, dominated by lamp electricity and H₂O₂. Fenton runs ¥5–¥10/m³, with H₂O₂, ferrous sulfate, and sludge disposal (¥1.5K–¥3K/ton) as the main lines. Catalytic ozonation runs ¥6–¥12/m³, weighted toward ozone generation electricity and periodic catalyst replacement.
Hidden costs shift total cost of ownership. UV lamp replacement runs ¥50K–¥100K/year at 8,000–12,000 hour service life. Catalytic ozonation catalyst replacement runs ¥200K–¥500K/year on a 1–3 year cycle. Fenton sludge handling and disposal is the line item operators most underestimate. Most plants we audit have a 2–5 year ROI, driven by avoided fines (¥2.1M/year TMAH exceedance case above), 30–50% lower downstream coagulant use, and reuse credits. A 50 m³/h catalytic ozonation retrofit in Shanghai cut OPEX by 40% versus the UV/H₂O₂ baseline and hit a 3.2-year payback (HydropureWater field data, 2025). For broader OPEX tactics, see cost-saving strategies for AOP systems.
| Cost Category | UV/H₂O₂ System (10 m³/h) | Fenton Oxidation System (10 m³/h) | Catalytic Ozonation System (10 m³/h) |
|---|---|---|---|
| CapEx (2026) | ¥1.2M–¥3.0M | ¥500K–¥1.2M | ¥1.5M–¥3.5M |
| OPEX (per m³) | ¥8–¥15 | ¥5–¥10 | ¥6–¥12 |
| Primary OPEX Drivers | Electricity, H₂O₂ | H₂O₂, FeSO₄, Sludge Disposal | Electricity (O₃ gen), Catalyst Replacement |
| Hidden Costs | UV Lamp Replacement (¥50K–¥100K/year) | Sludge Disposal (¥1.5K–¥3K/ton) | Catalyst Replacement (¥200K–¥500K/year) |
| Typical ROI | 3–5 years | 2–4 years | 2–5 years |
Compliance Blueprint: How AOPs Meet Global Solvent Discharge Limits
AOPs routinely deliver 95–99% removal of target solvents, putting facilities inside major discharge envelopes. Solvent advanced oxidation supports IPA below 5 mg/L (EPA 822-R-23-001) and acetone below 10 mg/L (EPA 40 CFR Part 414). Earlier drafts cited a 1 mg/L TMAH cap under 40 CFR Part 433; eCFR shows Part 433 metal finishing limits with a 2.13 mg/L daily-maximum TTO standard and no TMAH numeric limit. Earlier citations linked a 125 mg/L COD threshold to Directive 2010/75/EU; that directive requires BAT-based, installation-specific ELVs rather than a single COD number. In the EU, AOPs paired with MBR membrane bioreactors or RO still help plants hit permit COD values that often sit near 125 mg/L. In China, AOPs support COD below 50 mg/L (GB 8978-1996). Earlier text linked TMAH below 0.5 mg/L to GB 31570-2015; that standard covers petroleum refining emissions, not TMAH solvent limits. Catalytic ozonation is favored on flows above 100 m³/h.
- Pre-treatment: Install dissolved air flotation (DAF) upstream to strip TSS and protect AOP reactors from fouling.
- AOP reactor sizing: Hold retention time at ≥30 minutes and dose oxidant against the measured influent COD.
- Post-treatment: Add activated carbon for residual oxidant quenching, or MBR/RO for reuse trains.
- Continuous monitoring: Use online COD and TMAH analyzers for real-time compliance verification.
Risk mitigation covers disinfection by-products (DBPs). Ozonation can form bromate in bromide-bearing waters; H₂O₂ with chloride can yield chlorate. Persulfate-based AOPs are the practical fallback when DBPs are a project killer.
Who This Spec Is For, and Next Step
This blueprint is for procurement and process engineers at semiconductor fabs, PCB plants, pharmaceutical API lines, and specialty chemical sites discharging TMAH, IPA, or acetone. It is not the right starting point for domestic sewage, high-BOD food waste, or pure-water polishing unrelated to solvent removal—those routes call for biological or membrane systems instead. To move from spec to bid package, send your influent profile (COD, TSS, target solvent, flow) and discharge limits and we'll size a reactor and return a priced proposal: request an AOP system quote.
Frequently Asked Questions
What is the best AOP for high-TMAH wastewater?
Catalytic ozonation or UV/persulfate are preferred for high-TMAH streams. Both deliver 99%+ TMAH removal at neutral pH, avoiding the pH swing and iron sludge that complicate Fenton. For deeper engineering detail, see TMAH-specific AOP engineering specs and compliance strategies.
How much does a 10 m³/h AOP system cost?
Capital expenditure for a 10 m³/h AOP unit in 2026 spans ¥500K to ¥3.5M. Fenton oxidation is the entry-level option at ¥500K–¥1.2M, catalytic ozonation sits at ¥1.5M–¥3.5M, and UV/H₂O₂ systems range ¥1.2M–¥3.0M. Most projects land in the mid-range once PLCs, dosing skids, and post-treatment are added.
Can AOPs treat mixed solvent waste (TMAH + IPA + acetone)?
Yes. Mixed solvent streams respond well to AOPs, but expect 20–40% higher oxidant doses than single-solvent feeds because the radicals distribute across competing organics. Sizing the reactor for the highest-COD solvent in the mix keeps the rest of the train inside compliance.
Do AOPs require pre-treatment?
Almost always. TSS above 50 mg/L fouls UV lamps and coats catalyst surfaces, which drags efficiency and raises maintenance. Dissolved air flotation (DAF) or sedimentation ahead of the AOP reactor is standard practice on industrial solvent streams.
What is the lifespan of AOP catalysts and UV lamps?
Catalytic ozonation catalysts typically last 1–3 years, depending on the catalyst material, feedwater quality, and operating temperature. UV lamps in UV/H₂O₂ systems run 8,000–12,000 hours, which is roughly 1–1.5 years of continuous service before replacement.
What does Fenton oxidation cost to run?
Fenton OPEX typically lands at ¥5–¥10 per m³ for solvent wastewater, driven by H₂O₂, FeSO₄, and sludge disposal at ¥1.5K–¥3K/ton. At 0.3–0.8 kg H₂O₂ per kg COD treated, reagent cost scales directly with influent COD. Most plants we size keep mixing energy at 0.1–0.3 kWh/m³, so chemicals and sludge—not power—dominate the bill.
How do AOPs cut total ownership cost?
AOPs cut total ownership cost by avoiding exceedance fines, trimming downstream coagulant use 30–50%, and unlocking reuse credits. A 50 m³/h catalytic ozonation retrofit in Shanghai cut OPEX 40% versus UV/H₂O₂ and paid back in 3.2 years (HydropureWater field data, 2025). CapEx spans ¥500K–¥3.5M for 10 m³/h, with typical ROI of 2–5 years once hidden lamp or catalyst replacements are booked.