
Why AAO Energy Efficiency Is the 2026 Compliance Bottleneck
Municipal water and wastewater systems consume roughly 2% of total U.S. electricity, emit more than 45 million tons of CO₂-equivalent per year, and account for 30–40% of a typical city's energy use; within the wastewater utility itself, energy is 25–30% of total O&M spend, which makes it the largest controllable line item on a 2026 operating budget (per EPA, "Energy Efficiency for Water Utilities"). Add EU Directive (EU) 2024/3019, which pushes municipal WWTPs toward energy neutrality, and the AAO basin stops being a process choice and becomes a compliance bottleneck. The 2025 ScienceDirect latent-class study of 203 Spanish WWTPs put hard numbers on the headroom: average energy efficiency scores of 0.581 (Class 1) and 0.639 (Class 2), with up to 41.9% recoverable savings, equivalent to 16.9 GWh, €1.48 million, and 4,399 tCO₂e per year if the entire fleet closed the gap without sacrificing effluent quality. Because AAO is the predominant biological process in Chinese municipal WWTPs and a common global reference (Nature, 2024, s41545-024-00361-2), the directive pressure lands directly on its aeration tanks. For a 2026 engineer with a CFO asking why the kWh/m³ number is not falling, the answer is that the dominant AAO load — the oxic-zone blower — is still being run on a fixed-speed duty cycle with conservative DO setpoints inherited from a 2010-era design.
Where the kWh Actually Go in an AAO Train
AAO energy decomposes into five load blocks, and operators need to see them separately before picking a retrofit. The oxic-tank aeration blower train dominates at 50–60% of total plant kWh, because nitrification must be sustained and the DO setpoint window of 1.5–2.5 mg/L has to be met against a continuously varying oxygen demand. The internal recycle (IR) and mixed liquor return (MLR) pumps sit in second place at 10–15%, driven by design-default recycle ratios that are rarely trimmed against the actual nitrate load. Influent lift pumps run 5–10%, anoxic-zone submersible mixers 3–5% (mixing is cheap compared to oxygen transfer), and the remainder is split between UV/filtration and sludge handling. The thermodynamic reason the oxic tank dominates is the 1.5–2.0 kWh required to transfer 1 kg of dissolved oxygen through fine-bubble diffusers at typical clean-water Standard Oxygen Transfer Efficiency (SOTE) of 25–35%; every milligram of excess DO above what nitrification actually needs is paid for twice — once at the blower and once in wasted denitrification carbon downstream. A 2024 Nature data-driven optimization study noted that AAO's pollutant-removal convenience is purchased at exactly this energy cost, and that biotoxicity control in AAO effluents remains contested (Shi et al. 2017 coking case) — meaning operators should not trade energy headroom for compliance slack they do not actually need.
AAO Energy Benchmarks by Influent C/N Ratio (kWh/m³ and kWh/kg N)
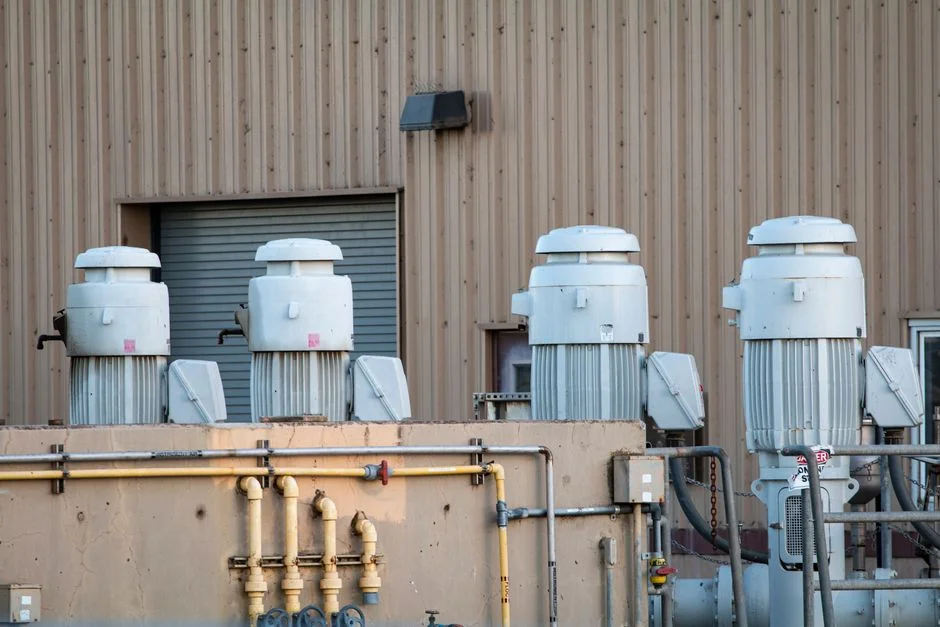
The single most useful number an engineer can put on a retrofit business case is kWh/m³, and that number is not constant — it moves with influent carbon-to-nitrogen ratio because denitrification carbon and aeration intensity are coupled. The benchmark ranges below translate the 2025 ScienceDirect efficiency scores of 0.581–0.639 into operational kWh/m³ bands, anchored on a typical 0.25–0.45 kWh/m³ envelope for realistic AAO plants:
| Influent C/N | Typical COD (mg/L) | Typical TN (mg/L) | kWh/m³ treated | kWh/kg COD removed | kWh/kg TN removed |
|---|---|---|---|---|---|
| < 5 (carbon-limited) | 180–280 | 45–60 | 0.40–0.45 | 1.4–1.8 | 14–18 |
| 5–7 (typical municipal) | 280–420 | 40–55 | 0.32–0.40 | 1.0–1.3 | 10–14 |
| 7–10 (favorable) | 420–600 | 40–55 | 0.28–0.32 | 0.8–1.0 | 8–11 |
| > 10 (industrial / mixed) | 600–900 | 40–70 | 0.25–0.30 | 0.6–0.9 | 7–10 |
A plant running 0.45 kWh/m³ is sitting near the 0.581 efficiency-score band from the ScienceDirect fleet study, which means an EPA-cited 15–30% audit-savings envelope corresponds to 0.07–0.14 kWh/m³ of headroom from operational measures alone, before any capital retrofit. Below C/N 6, the aeration kWh inflates because the operator must dose external carbon (methanol or acetate) for denitrification, which adds both chemical cost and indirect energy load in production and delivery — a real but often invisible line item on the energy balance sheet.
AAO vs A²O-MBR vs AAO-IFAS: Energy per kg Nutrient Removed
When procurement floats a process upgrade rather than an operational tune, the decision axis is energy per kilogram of nutrient actually removed, not per cubic meter treated. The head-to-head below uses the conventional AAO row as the 1.0× baseline and the ScienceDirect 0.581–0.639 fleet scores as the calibration anchor:
| Process variant | Footprint | Effluent quality | kWh/m³ | kWh/kg NH₄-N removed | kWh/kg TN removed | CAPEX indicator | Best-fit scenario |
|---|---|---|---|---|---|---|---|
| Conventional AAO | 1.0× baseline | Meets TN < 15 mg/L with margin | 0.25–0.45 | 5–8 | 10–18 | Low | Standard municipal discharge |
| A²O-MBR (e.g., DF series MBR flat sheet membrane module) | 0.5–0.7× | < 1 μm filtrate; reuse-ready | 0.30–0.55 (10–25% higher) | 6–9 | 12–20 | High (membranes + scour air) | Industrial reuse, water-reuse compliance |
| AAO-IFAS (hybrid biofilm) | 0.7–0.9× | Comparable to AAO at shorter HRT | 0.22–0.40 (10–20% lower per kg N) | 4–7 | 8–14 | Medium (carrier media) | TN-limited retrofits, cold-climate plants |
The rule of thumb: A²O-MBR shifts roughly 10–15% of plant kWh from the aeration blower to membrane scour blowers and recirculation pumps, so total plant kWh is 10–25% higher than AAO — but the effluent quality step-change to a sub-micron filtrate is what justifies the energy premium in a water-reuse application. AAO-IFAS uses biofilm carriers to raise effective MLSS without raising clarifier loading, which shortens HRT and delivers 10–20% lower kWh per kg N removed versus a baseline AAO at equivalent effluent, making it the right call when energy is the primary driver. For a deeper process-selection breakdown, the IFAS advantages and disadvantages 2026 buyer's guide covers carrier geometry and retrofit sequencing, while the activated sludge vs biofilm cost breakdown 2026 puts the CAPEX/OPEX numbers next to the energy delta.
Aeration Blower Tuning: DO Setpoint, VFDs, and Airflow Distribution
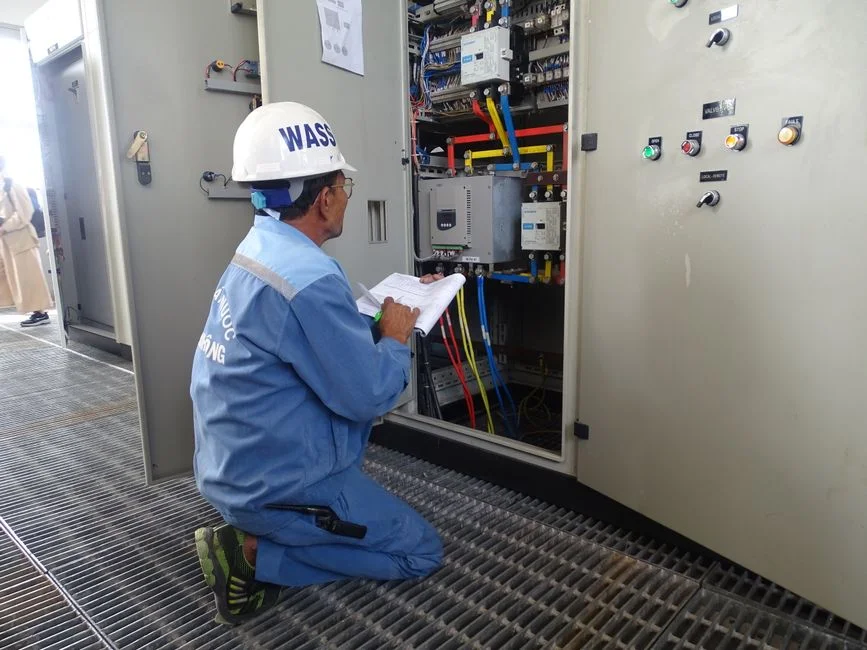
Three concrete actions deliver the bulk of the 20–30% aeration kWh reduction that the EPA audit-savings range implies. First, DO setpoint discipline: a typical over-aerated plant runs the oxic tank at 2.0–2.5 mg/L because that is the design margin, but a tuned cascade controller on a well-instrumented basin will hold 1.2–1.5 mg/L without measurable loss of nitrification rate, cutting blower kWh 10–18% — a number that lines up with the 0.581 ScienceDirect baseline representing a typical over-aerated facility. Second, VFDs on positive-displacement or high-speed turbo blowers enable turndown from 100% airflow to 30–40% during low-load night periods; documented savings bands cluster at 15–25% on blower electricity, with the larger number on positive-displacement machines that previously ran on inlet throttling. Third, diffuser maintenance: a 1 mm biofilm or chemical-fouling film on a fine-bubble membrane raises Standard Oxygen Transfer Rate (SOTR) demand 15–20% before any visible pressure-drop change, so a 5–10% gain is available simply from putting diffuser inspection on the energy-audit checklist. EPA's Energy Management Guidebook approach — baseline → audit → prioritize → measure — maps cleanly onto these three actions: baseline the blower kWh/m³, audit the DO controller tuning, prioritize the lowest-CAPEX action (DO setpoint and diffuser clean) first, then measure the blower kWh/m³ again before sizing a VFD.
Internal Recycle and Mixed Liquor Return Optimization
MLR (clarifier return to the anaerobic or anoxic head) and IR (nitrate recycle from oxic back to anoxic) are the second-biggest pump-driven load, and they are almost always left at design default. Typical settings are MLR at 50–100% of influent flow and IR at 200–400% of influent flow; each 100% increment in IR adds roughly 3–5% to total plant kWh because it scales the pump hydraulic power almost linearly. The minimum-IR rule is mechanical: IR ≈ (NO₃-N to be denitrified, expressed as N) × 2.86 / influent NO₃-N mass flux; above that ratio, the recycle is pumping mixed liquor that has already denitrified what it can. In a TN-limited plant, trimming IR from 400% to 250% is a near-zero-CAPEX action worth 4–7% of plant kWh, delivered by changing a VFD setpoint or a pump-speed drive. MLR is harder to optimize blindly because it is coupled to clarifier sludge-blanket behavior — over-pumping wastes energy and ages the sludge, under-pumping starves the anoxic zone of carbon-loaded biomass — so it should be reset only after a settling test against the actual SVI. The cross-link to the next section is direct: a plant that has dropped its oxic DO setpoint will generate a different nitrate profile, which means the IR trim has to be re-tuned as a follow-up step, not in isolation.
Worked Payback Example: 1,000 m³/d AAO Plant, VFD + DO Control Retrofit
A defensible procurement case needs a number a CFO can sign. The worked example below uses a 1,000 m³/d industrial AAO plant currently drawing 0.42 kWh/m³ on flat-rate electricity, with the retrofit scope limited to the four actions discussed above (VFD on each aeration blower, DO cascade controller on the oxic tank, IR trim from 350% to 250%, and a diffuser clean). The result lands inside the EPA "few months to a few years" audit payback envelope and scales to a fleet-level roll-out:
| Parameter | Baseline | Post-retrofit | Notes |
|---|---|---|---|
| Daily flow | 1,000 m³/d | 1,000 m³/d | Industrial AAO train |
| Specific energy | 0.42 kWh/m³ | 0.33 kWh/m³ (-22%) | Per the 20–30% EPA audit band |
| Annual energy | 153,300 kWh/yr | 120,500 kWh/yr | At 8,000 operating hours/yr |
| Electricity cost | $33,600/yr (at $0.10/kWh) | $26,400/yr | Saving ≈ $7,400/yr |
| CAPEX band | — | $80,000–$140,000 | VFDs + DO probes + controller + diffuser clean |
| Simple payback | — | 11–19 months | Inside the EPA audit payback range |
Scale this single plant by a 10-plant fleet at the same profile and the annual savings track the 16.9 GWh/yr and €1.48M/yr figures from the 2025 Spanish fleet study, giving a director-level roll-out case grounded in published numbers rather than vendor projections. The post-retrofit kWh/m³ of 0.33 still sits above the 0.25–0.30 floor achievable on a warm-climate C/N>8 influent, which means further headroom is available through heat integration and resource-recovery sidestreams discussed in the resource recovery from wastewater 2026 breakdown, and through high-nitrate influent optimization covered in the high nitrate wastewater treatment 2026 guide. For plants struggling with high-nitrate industrial loads that need supplemental carbon dosing, pairing a VFD retrofit with a HydropureWater automatic chemical dosing system on the methanol or acetate feed tightens the carbon-control loop and prevents the post-denitrification energy penalty described in the benchmark table above.
Frequently Asked Questions
What kWh/m³ should a well-run AAO plant target in 2026?
0.25–0.30 kWh/m³ on a warm-climate, C/N>8 influent, and 0.32–0.45 kWh/m³ for typical municipal plants in the 5–7 C/N range, anchored on the 2025 ScienceDirect fleet efficiency scores of 0.581–0.639.
How much aeration energy can a VFD blower retrofit actually save?
20–30% on blower electricity when combined with DO setpoint discipline (1.2–1.5 mg/L instead of 2.0–2.5 mg/L) and a clean diffuser, with simple payback of 11–19 months on a 1,000 m³/d plant at $0.10/kWh.
Is AAO-IFAS or A²O-MBR more energy-efficient than baseline AAO?
AAO-IFAS delivers 10–20% lower kWh per kg N removed at comparable effluent, while A²O-MBR runs 10–25% higher in total kWh but produces reuse-grade sub-micron filtrate — so IFAS wins on energy, MBR wins on water reuse.
What is the binding 2026 regulatory driver for AAO energy retrofits?
EU Directive (EU) 2024/3019, which sets municipal WWTPs on a path to energy neutrality and underpins the 41.9% recoverable-savings ceiling documented in the 2025 ScienceDirect study of 203 Spanish plants.
Related Equipment
- DF series MBR flat sheet membrane module — specifications, capacity range, and technical data
- GX series rotary mechanical bar screen — specifications, capacity range, and technical data