What Counts as High Nitrate Wastewater — and Why It Matters in 2026
Plants treat high nitrate wastewater when industrial streams exceed 100 mg NO3-N/L, ten times the WHO drinking-water limit of 11.3 mg NO3-N/L (Fernández-Nava 2008). Loads above 500 mg NO3-N/L need industrial trains, not potable polishers. Six sectors routinely exceed 1,000 mg NO3-N/L: cellophane, explosives, fertilizer, pectin, metal finishing, and nuclear fuel reprocessing.
Those sectors size for true industrial loadings, not drinking-water packages. Supporting literature includes Bilanovic 1999, Zala 1999, and Watanabe 2001 as cited in Fernández-Nava 2008. Ion exchange or RO trains built for potable polish cannot handle these concentrations alone.
WHO and EU Directive 98/83/EC still cap drinking water at 50 mg NO3/L; the US EPA holds 10 mg NO3/L. Discharge rules are tighter. EU Directive 91/271/EEC sets 10–30 mg NO3-N/L for freshwater discharge and 10–15 mg Total-N/L in sensitive areas. Through 2026, US EPA TKN plus nitrate-nitrite caps keep tightening in reissued NPDES permits. Fertilizer and metal-finishing reuse programs often push effluent below 10 mg NO3-N/L for closed loops.
For fertilizer, metal finishing, explosives, pectin, cellophane, or aquaculture streams above 500 mg NO3-N/L, the decision is which train meets both discharge and reuse specs inside capital and operating budget.
Why Nitrate Is Hard to Remove: Chemistry, Kinetics, and Process Constraints
Nitrate (NO3−) holds nitrogen at the +5 oxidation state, the most stable aqueous form. Conventional coagulation, sedimentation, and lime softening cannot precipitate that fully oxidized anion. Nitrate therefore passes primary and secondary clarification in most plants with almost no removal.
Biological denitrification is the only widely deployed route that destroys nitrate. The pathway runs NO3− → NO2− → NO → N2O → N2 under anoxic conditions (dissolved oxygen below 0.5 mg/L) with a carbon source. Heterotrophic denitrifiers need a C/N ratio of 2.5–4.0 as BOD-to-nitrate-nitrogen, so methanol, ethanol, or acetic acid dosing is standard (Rossi 2014). At 1,000 mg NO3-N/L feed, that means 2,500–4,000 mg/L BOD-equivalent demand. That dose drives tank volume, oxygen exclusion, and methanol inventory.
Competing ions reshape every shortlist. Calcium above 800 mg Ca²⁺/L, common in Fernández-Nava's stainless steel waste, precipitates carbonate in denitrification basins and scales RO membranes. Sulfate above 500 mg/L competes with nitrate on strong-base anion resin and cuts capacity by 20–30%. Chloride above 5,000 mg/L raises RO osmotic pressure and pushes pump energy above 1.2 kWh/m³. Most plants we size for high-calcium metal finishing therefore drop biological recovery targets before they chase resin capacity. The influent matrix selects the train; a single “best” technology does not exist.
How Plants Treat High Nitrate Streams: Four Technology Families
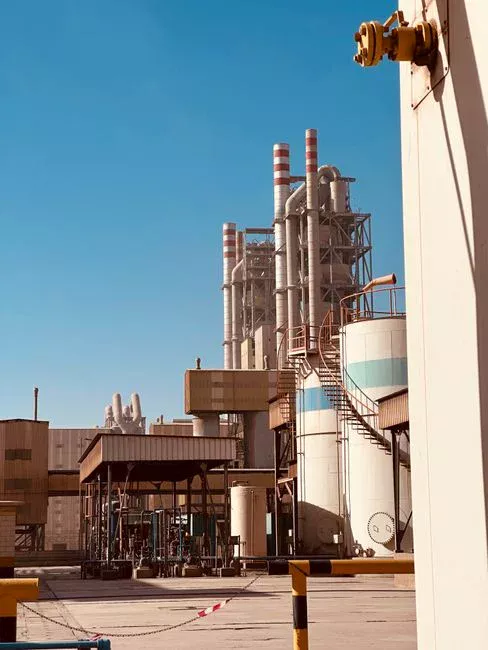
Biological denitrification covers industrial streams in the 100–3,000 mg NO3-N/L band. Suspended-growth layouts (modified Ludzack-Ettinger, A²O, sequencing batch reactors) and attached-growth systems (moving bed biofilm reactor, fluidized bed, biological aerated filter) place mixed liquor or biofilm in an anoxic tank with supplemental carbon. Methanol at 2.5–3.0 g per g NO3-N removed is the usual electron donor. Ethanol and acetic acid biodegrade more readily but cost 15–25% more per equivalent dose. Reported removal is 95–99% (Rossi 2014; Fernández-Nava 2008).
Ion exchange uses strong-base anion resin (Purolite A520E, Amberlite IRA 900, or equivalent) in a fixed bed. Chloride-form resin swaps Cl− for NO3− and polishes effluent to 5–10 mg NO3-N/L until exhaustion at roughly 6–8 bed volumes per liter of resin. Regeneration with 6–10% NaCl yields brine at 5,000–15,000 mg NO3-N/L that still needs treatment. Single-pass removal is 80–90% (Fernández-Nava 2008); staging raises turndown.
Reverse osmosis uses thin-film composite polyamide membranes (for example Toray TM720 or DuPont Fortilife) at 10–30 bar feed pressure. Two-stage RO rejects 97–99% of nitrate and concentrates reject to 2,000–5,000 mg NO3-N/L for disposal or further concentration. Energy runs 0.8–1.5 kWh/m³ permeate at typical 70–80% recovery, depending on TDS. RO handles >1,000 mg NO3-N/L industrial feeds with the highest commercial single-pass removal (95–99%, Fernández-Nava 2008).
Electrodialysis (ED) and electrodialysis reversal (EDR) drive nitrate through selective anion-exchange membranes under a DC field. ED fits moderate salinities (1,000–10,000 mg/L TDS) where RO osmotic penalties climb steeply. EDR reverses polarity to break scale and tolerates calcium-rich streams better. Removal per pass is 60–80%; multi-stage stacks reach 90–95%.
Side-by-Side Comparison: Biological vs. Ion Exchange vs. RO vs. Electrodialysis
The table below consolidates operating envelope, cost band, and best-fit application against the EU 91/271/EEC sensitive-area target of 10–15 mg Total-N/L. Cost figures are 2026 industry estimates from current vendor benchmarks; research literature does not publish standardized CAPEX/OPEX across these four families.
| Technology | Influent NO3-N range (mg/L) | Removal efficiency | CAPEX (USD per m³/d capacity) | OPEX (USD per m³ treated) | Key byproduct / waste stream | Best fit |
|---|---|---|---|---|---|---|
| Biological denitrification | 100–3,000 | 95–99% | $600–$1,200 | $0.20–$0.60 | Excess sludge, methanol residue | Municipal & industrial streams with biodegradable carbon or external dosing budget |
| Ion exchange | 10–100 (polishing) | 80–90% | $800–$1,600 | $0.80–$1.50 | NaCl brine with concentrated NO3− | Drinking water & low-strength polishing; <100 mg/L post-biological |
| Reverse osmosis | 200–5,000+ | 95–99% | $1,200–$2,500 | $0.50–$1.20 | Concentrate 2,000–5,000 mg NO3-N/L (15–25% of feed volume) | High-strength industrial streams, water reuse, brine minimization |
| Electrodialysis (ED/EDR) | 200–3,000 | 60–95% (multi-stage) | $1,500–$3,000 | $1.00–$2.00 | Concentrate brine, lower volume than RO | High-TDS industrial streams, calcium scaling risk where RO recovery is capped |
For a deeper look at how these technologies stack up across ammonia, TKN, and total nitrogen, see this 2026 buyer's guide to total nitrogen removal technologies.
Process Selection: Matching Technology to Influent Profile
Process selection for nitrate trains starts with the influent matrix. Three decision rules then lock the unit train:
- Above 500 mg NO3-N/L, biodegradable carbon available: Lead with biological denitrification (A/O, A²O, or MBR) targeting 95–99% removal. If the downstream spec calls for closed-loop reuse or sub-10 mg NO3-N/L, add RO polish on the biological effluent. For industrial streams in the 100–2,000 mg NO3-N/L range, an MBR membrane bioreactor for biological denitrification delivers high MLSS (8,000–12,000 mg/L) and tolerates the variable loads typical of fertilizer and metal finishing operations. After the anoxic stage, a High-Efficiency Sedimentation Tank (Lamella Clarifier) settles excess biomass before polish or discharge when a separate clarifier is preferred over membrane solids separation.
- TDS above 5,000 mg/L or inhibitory calcium: Skip straight to RO or electrodialysis. Fernández-Nava 2008's stainless steel waste exceeded 1,600 mg Ca²⁺/L, a profile that scales biological basins and fouls RO membranes at recovery above 70%. EDR with polarity reversal handles calcium up to 1,200 mg/L with anti-scalant dosing, and RO at controlled 65% recovery remains viable with periodic CIP.
- Discharge target <15 mg Total-N/L and influent already <100 mg/L: Specify ion exchange as the primary polishing step after biological treatment. Resin life is 3–5 years with proper regeneration, and the brine byproduct can be returned upstream to the biological reactor for nitrogen destruction, closing the loop.
Selection checklist before you freeze P&ID and budget:
- Measure NO3-N, NO2-N, TKN, BOD/COD, TDS, Ca²⁺, SO4²−, and Cl− on the same composite sample.
- Confirm discharge or reuse target as NO3-N or Total-N, including any seasonal NPDES language.
- Check biodegradable carbon availability; if C/N sits below 2.5, price external methanol or ethanol.
- Decide brine and concentrate fate early—deep well, evaporation, ZLD, or return to biology.
- Match solids separation to the biological layout: membrane (MBR) versus lamella clarification.
- Stress-test energy at design TDS; RO above about 1.2 kWh/m³ often loses to EDR on calcium-rich feeds.
- Include CIP, resin replacement, and methanol storage in year-1 OPEX, not only power and labor.
2026 Cost Data: CAPEX, OPEX, and ROI for Industrial Nitrate Removal
For a 500 m³/d industrial nitrate plant in 2026, biological CAPEX runs $300K–$1.2M. Ion exchange lands at $400K–$1.0M. RO skids run $600K–$2.0M, with ED/EDR at the upper end. These are 2026 vendor-benchmark estimates. Published research does not standardize CAPEX across the four families.
Operating cost drivers are process-specific. In biological systems, methanol accounts for 40–60% of OPEX at 2.5–3.0 g per g NO3-N removed. Ethanol at 3.5 g/g runs about 20% cheaper per equivalent but needs larger dosing tanks. Feed control within ±2% of setpoint matters: overdosing wastes reagent and underdosing leaves residual nitrate. An automatic chemical dosing for methanol or ethanol feed system holds the C/N ratio inside the 2.5–4.0 window and cuts chemical OPEX 10–18% versus manual feed. In ion exchange, resin replacement and NaCl purchase drive 10–15% of OPEX; spent brine disposal is the line item that scales fastest. In RO, membrane replacement every 5–7 years plus energy make up 50–65% of OPEX, so energy recovery devices earn their premium above 200 m³/d capacity.
Who This Is For, Who Should Look Elsewhere, and Next Step
This guide is for plant engineers, EPC process leads, and procurement managers. It targets industrial nitrate above about 100 mg NO3-N/L in fertilizer, metal finishing, explosives, pectin, and cellophane waste. Teams that only need municipal drinking-water polish below 50 mg NO3/L should start with potable ion-exchange or RO packages. If you already have influent data and a discharge or reuse target, share the load sheet through our nitrate treatment inquiry form. A process engineer can then shortlist biological, RO, or hybrid options against your C/N and calcium constraints.
Frequently Asked Questions
What C/N ratio is optimal for biological denitrification?
The target BOD-to-NO3-N ratio is 2.5–4.0, with 3.0 the practical optimum for methanol-fed systems. Below 2.5, denitrification stalls and nitrite accumulates. Above 4.0, residual carbon drives BOD breakthrough in the clarifier (Rossi 2014). Most industrial basins we commission settle near 3.0 when methanol inventory and dosing precision are reliable.
How often does ion exchange resin need regeneration?
A strong-base anion resin treating 50 mg NO3-N/L feed typically exhausts after 6–8 bed volumes of throughput. That usually means regeneration every 8–12 hours in a two-bed duty/standby pair. Brine consumption runs 100–150 g NaCl per liter of resin per cycle, and spent brine still needs a destruction or disposal path.
What are the options for RO concentrate disposal?
Three routes dominate: deep-well injection where permits allow, evaporation ponds where climate and land support them, and zero-liquid-discharge crystallization at 15–25 kWh/m³. A fourth option returns concentrate upstream to a biological reactor so concentrated NO3-N is destroyed by denitrification instead of shipped off site.
Should I choose biological or RO for a 500 mg NO3-N/L industrial stream?
Lead with biological denitrification when biodegradable carbon is available and discharge goes to surface water or sewer; OPEX typically runs $0.20–$0.60/m³. Choose RO for water reuse with sub-10 mg NO3-N/L permeate, or when inhibitory calcium above 800 mg/L would disrupt biological kinetics. Most 2026 designs combine both: biological for load reduction, RO for polish.