Why Sewage Plants Adopt Membrane Bioreactors
Membrane bioreactor (MBR) plants combine activated sludge with 0.04–0.4 μm MF/UF membranes. Typical municipal MBR specifications use MLSS 8,000–12,000 mg/L, HRT 4–8 h, TSS below 1 mg/L, and BOD below 5 mg/L. Footprint is often 50–70% smaller than clarifier trains when secondary clarifiers and tertiary filters are removed.Annex I of 91/271/EEC still sets secondary-treatment concentration limits of BOD 25 mg/L, COD 125 mg/L, and TSS 35 mg/L where that parameter applies. Most plants we size for dense cities run at the lower end of the footprint range because land, not membrane cost, is the binding constraint.
A 5,000 m³/day Singapore case in the source brief cut plant area from about 1,200 m² to 400 m² after switching to MBR. Conventional trains still struggle with sludge bulking, clarifier washout, and seasonal settling swings. MBR keeps a physical barrier in place, so TSS and pathogen removal stay stable when settleability fails.
MBR System Core Components and How They Work Together
An MBR couples a high-MLSS bioreactor with a membrane solid–liquid separator. Mixed liquor typically runs 8,000–12,000 mg/L, versus 2,000–4,000 mg/L in conventional activated sludge. Solids retention time (SRT) of 20–50 days supports nitrification and harder organics. Membranes in PVDF or PES, as flat sheet or hollow fiber, reject biomass while permeate is drawn at controlled flux.
Fine-bubble scour in submerged tanks usually needs 0.2–0.6 Nm³/m²·h of air across the membrane area. Coarse-bubble air may still serve the biological zone. Process order is influent, fine screen, anoxic and aerobic zones, then the membrane tank. Operators watch dissolved oxygen, MLSS, and transmembrane pressure (TMP) as the primary control points.
| Stage | Description | Key Parameters |
|---|---|---|
| Influent | Raw sewage enters the system. | Flow rate, COD, BOD, TSS |
| Fine Screening | Removal of larger solids (typically < 3 mm). | Screen aperture size |
| Anoxic Zone | Denitrification occurs. | DO, Nitrate levels |
| Aerobic Zone | Organic matter removal and nitrification. | DO, MLSS concentration, SRT |
| Membrane Tank | Biomass separation via MF/UF membranes. | MLSS concentration, Scouring airflow, TMP |
| Permeate Pumping | Treated water is drawn through membranes. | Flux rate, TMP |
| Effluent | Treated water discharged or reused. | TSS, BOD, COD, TN, TP |
For packaged trains, a MBR Membrane Bioreactor Wastewater Treatment System integrates the bioreactor and submerged modules in one skid envelope.
MBR Specifications: 2026 Engineering Data for Design
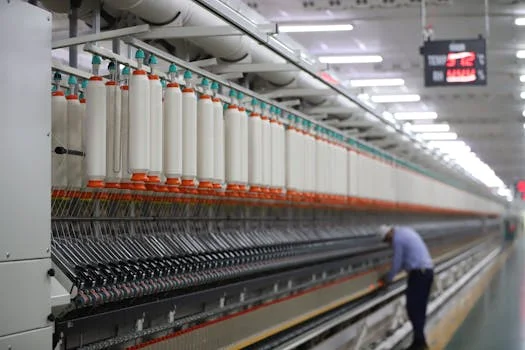
Municipal membranes commonly use 0.1 μm flat-sheet pores (DF Series class) or about 0.04 μm hollow fiber. Design permeate flux is usually 15–30 LMH on municipal sewage and 8–20 LMH on stronger industrial loads. TMP is held near 10–50 kPa; sustained values above that band flag fouling or scaling. Chemical cleans every 3–6 months keep permeability in range for most municipal feeds.
Process setpoints stay close to MLSS 8,000–12,000 mg/L, F/M 0.05–0.15 kg BOD/kg MLSS·d, and SRT 20–50 days. Municipal HRT is typically 4–8 hours; industrial HRT often stretches to 12–24 hours. Submerged plants often need only 0.05–0.1 m²/m³/day of plot, versus about 0.15–0.3 m²/m³/day for clarifier trains. Specific energy for submerged MBR commonly lands at 0.6–1.2 kWh/m³, with roughly 60% in aeration and scour, 30% in permeate pumping, and 10% in ancillary loads.
Effluent benchmarks for well-operated MBR trains remain TSS <1 mg/L, BOD <5 mg/L, COD <30 mg/L, TN <10 mg/L, and TP <1 mg/L under the design loads above. Those values sit well below Annex I secondary limits in Directive 91/271/EEC and support reuse polishing trains when permits demand it.
| Parameter | Typical Range (Municipal) | Typical Range (Industrial) | Notes |
|---|---|---|---|
| Membrane Pore Size | 0.04–0.1 μm | 0.04–0.1 μm | For MF/UF membranes |
| Permeate Flux Rate | 15–30 LMH | 8–20 LMH | Subject to influent characteristics |
| Transmembrane Pressure (TMP) | 10–50 kPa | 10–50 kPa | Alarm at >50 kPa |
| MLSS Concentration | 8,000–12,000 mg/L | 8,000–12,000 mg/L | Can be higher for specific industrial applications |
| SRT | 20–50 days | 20–50 days | Enables nutrient removal |
| HRT | 4–8 hours | 12–24 hours | Bioreactor residence time |
| Footprint | 0.05–0.1 m²/m³/day | 0.05–0.1 m²/m³/day | Significantly smaller than conventional |
| Energy Consumption | 0.6–1.2 kWh/m³ | 0.6–1.2 kWh/m³ | Includes aeration and pumping |
| Effluent TSS | < 1 mg/L | < 1 mg/L | Meets reuse standards |
| Effluent BOD | < 5 mg/L | < 5 mg/L | |
| Effluent COD | < 30 mg/L | < 30 mg/L |
Module-level pore and packing details for flat-sheet trains are listed on the DF Series flat sheet membrane modules with 0.1 μm pore size.
How do clarifier selection criteria apply with MBR?
Clarifier selection criteria such as overflow rate and solids loading rate no longer size the final solids barrier once membranes replace secondary settling. Primary clarifiers may still stay upstream on high-TSS industrial feeds to cut grit and grease before the bioreactor. Secondary clarifier surface overflow rates of roughly 0.5–1.5 m³/m²·h become irrelevant; membrane area is set from net flux instead. If a plant already owns circular or rectangular secondary tanks, keep them only as equalization or sludge thickeners, not as the compliance barrier.
What sizing replaces overflow rate and solids loading?
Membrane area A equals design permeate flow divided by net flux (A = Q / J), not clarifier surface area. For municipal immersed MBR, net flux of 15–30 LMH at average day flow is the usual starting band, with short peaks only under documented stress tests. Solids loading shifts to MLSS inventory and SRT control: hold 8,000–12,000 mg/L and waste sludge to keep F/M inside 0.05–0.15 kg BOD/kg MLSS·d. Screen aperture at or below 3 mm protects fibers and sheets the way weir design once protected clarifier effluent.
Submerged vs. Sidestream MBR: Decision Framework for Your Project
Submerged MBR immerses modules in the bioreactor or a linked membrane tank and usually burns 0.6–1.0 kWh/m³. Sidestream MBR parks membranes in external loops and often uses 1.5–3.0 kWh/m³ because cross-flow pumps run continuously. Submerged layouts win on footprint for municipal sewage and tight urban sites. Sidestream layouts win when operators need fast cassette access on fouling-prone industrial wastewater from food, pharma, or chemical drains.
Use this field rule: if COD stays above about 1,000 mg/L or loads swing hard, shortlist sidestream first. If COD is municipal-strength and land is scarce, shortlist submerged. Flows below about 5,000 m³/day often favor submerged packages; larger industrial campuses can still scale either architecture if hydraulic peaks are buffered.
| Feature | Submerged MBR | Sidestream MBR | |
|---|---|---|---|
| Membrane Location | Immersed in bioreactor | Separate module | |
| Energy Consumption | 0.6–1.0 kWh/m³ | 1.5–3.0 kWh/m³ | Higher due to cross-flow pumping |
| Footprint | Smaller | Larger | Requires separate membrane housing |
| Capital Cost | Potentially higher (integrated design) | Potentially lower (modular) | Varies by scale and complexity |
| O&M Complexity | Lower routine O&M, but specialized maintenance for membranes | Easier membrane access for cleaning/replacement | |
| Fouling Management | Relies heavily on scouring aeration | Cross-flow pumping aids fouling control | |
| Ideal Applications | Municipal sewage, space-constrained sites | High-strength industrial wastewater, variable loads |
MBR vs. Conventional Systems vs. MBBR: Cost-Benefit Analysis for Procurement Teams
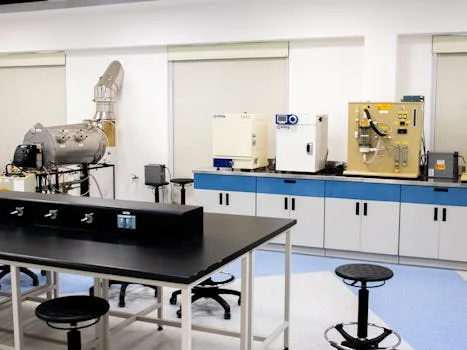
MBR capital cost typically sits at $1,200–$2,500/m³/day of capacity, against $800–$1,500/m³/day for conventional activated sludge and $1,000–$2,000/m³/day for MBBR. That premium buys removal of secondary clarifiers and most tertiary filters. O&M for MBR is about $0.15–$0.30/m³, a bit above conventional $0.10–$0.20/m³, mainly from aeration and permeate energy.
Sludge mass often drops 30–50% versus conventional wasting at short SRT, which offsets part of the energy premium. Plot demand of 0.05–0.1 m²/m³/day for MBR versus 0.2–0.4 m²/m³/day for conventional and 0.1–0.2 m²/m³/day for MBBR is decisive where urban land exceeds about $500/m². Effluent TSS <1 mg/L and BOD <5 mg/L from MBR routinely beat conventional 10–30 mg/L TSS and 10–20 mg/L BOD, and MBBR 5–15 mg/L TSS with 10–20 mg/L BOD, without a separate polishing clarifier.
| Metric | MBR | Conventional Activated Sludge | MBBR |
|---|---|---|---|
| Capital Cost ($/m³/day) | 1,200–2,500 | 800–1,500 | 1,000–2,000 |
| O&M Cost ($/m³) | 0.15–0.30 | 0.10–0.20 | 0.12–0.25 |
| Footprint (m²/m³/day) | 0.05–0.1 | 0.2–0.4 | 0.1–0.2 |
| Effluent TSS (mg/L) | < 1 | 10–30 | 5–15 |
| Effluent BOD (mg/L) | < 5 | 10–20 | 10–20 |
| Sludge Production | 30–50% less | Higher | Moderate |
| Key Advantage | Superior effluent quality, minimal footprint | Lower capital cost | Simpler operation, good for nutrient removal |
| Key Disadvantage | Higher capital cost, energy use | Larger footprint, lower effluent quality | Larger footprint than MBR, lower effluent quality than MBR |
Common MBR System Failures and How to Prevent Them
Membrane fouling rises when MLSS stays above 12,000 mg/L, scour air falls below 0.2 Nm³/m²·h, or chemical cleaning slips past the 3–6 month window. Hold MLSS nearer 8,000–10,000 mg/L for most municipal plants, keep scour near 0.3–0.5 Nm³/m²·h, and clean with citric acid or NaOCl on schedule. Foaming tracks high F/M above 0.15 kg BOD/kg MLSS·d or filament blooms; cut F/M toward 0.05–0.1, dose silicone antifoam if needed, or lengthen SRT toward 30–50 days.
Integrity loss often starts with grit or aggressive chlorination. Install a GX Series Rotary Mechanical Bar Screen for 3 mm pre-screening and avoid chronic free-chlorine soaks on PVDF. Watch TMP daily; alarm above 50 kPa, backwash every 10–15 minutes where the design allows, and start recovery cleaning if TMP stays above 30 kPa for 24 hours.
Selection Checklist, Fit, and Next Step
Who this is for: EPC and plant engineers sizing municipal or industrial sewage upgrades that need TSS <1 mg/L, tight land, or reuse-ready permeate. Who should look elsewhere: sites that only need secondary BOD/TSS limits, have cheap land, and cannot staff membrane CIP—conventional or MBBR trains usually cost less there.
- Confirm peak and average flow, COD, and temperature for flux derating.
- Choose submerged vs sidestream from strength, variability, and access needs.
- Lock screen aperture ≤3 mm and grit removal before membrane warranty talks.
- Budget energy at 0.6–1.2 kWh/m³ (submerged) or 1.5–3.0 kWh/m³ (sidestream).
- Set TMP, MLSS, and CIP triggers in the O&M contract, not only in the brochure.
- Compare land value against the $1,200–$2,500/m³/day MBR CAPEX band.
- Match effluent to GB 18918-2002 Class 1A or local reuse class, not generic “high quality.”
If you need a capacity and membrane-area check against the ranges above, compare a packaged submerged MBR system for municipal and industrial sewage with your current clarifier train, then send influent data through our MBR design inquiry form.
Frequently Asked Questions
What is MBR in sewage treatment?
MBR combines activated sludge with MF/UF membranes at 0.04–0.4 μm pore size to separate biomass without a secondary clarifier. Typical permeate is TSS <1 mg/L and BOD <5 mg/L when flux, MLSS, and CIP stay in design range. Plot use is often about 60% lower than clarifier-based trains at equal flow. The membrane, not settling velocity, sets effluent solids.
What are the disadvantages of MBRs?
Higher capital cost of about $1,200–$2,500/m³/day versus $800–$1,500/m³/day for conventional activated sludge is the first drawback. Specific energy of 0.6–1.2 kWh/m³ for submerged plants and membrane replacement every 5–10 years add OPEX. Fouling and foaming raise labor if scour air, MLSS, and CIP drift off setpoint. Plants without trained membrane staff should not buy MBR on footprint alone.
What is the difference between MBR and clarifier?
MBR uses 0.04–0.4 μm membranes to hold biomass and typically delivers TSS <1 mg/L. Secondary clarifiers rely on gravity settling and usually leave TSS at 10–30 mg/L. MBR plants are often about 60% smaller in footprint and cost roughly 30–50% more in upfront CAPEX. Overflow rate sizing applies to clarifiers; net flux sizing applies to membranes.
What are the disadvantages of using MBBR?
MBBR uses biofilm carriers instead of membranes, so effluent is usually TSS 5–15 mg/L and BOD 10–20 mg/L without extra filtration. Footprint of 0.1–0.2 m²/m³/day is larger than MBR’s 0.05–0.1 m²/m³/day band. Operation is simpler, but reuse or Class 1A solids targets still need polishing. Choose MBBR when land is available and discharge limits are moderate.
How often do MBR membranes need replacement?
PVDF membranes commonly last 5–10 years when 3 mm screening and scheduled chemical cleaning stay in place. Ceramic options can exceed 15 years but often cost two to three times more at purchase. Replace when sustained flux falls below about 50% of the clean baseline or TMP stays above 50 kPa for 24 hours after recovery cleans. Warranty language should state those triggers in writing.