Why Phenol Discharge Limits Drive Method Choice
The US EPA has designated phenol as a priority pollutant and set a water purity standard of less than 1 ppb in surface water, per Current Pollution Reports (2016). Toxic effects on humans and aquatic life appear in the 9–25 mg/L range, also per Current Pollution Reports (2016), and Applied Water Science (2014) documents the World Health Organization maximum permissible concentration of 1 mg/L in drinking water. Industrial sources cited in Current Pollution Reports (2016) include oil refining, petrochemicals, pharmaceuticals, coking operations, resin manufacturing, plastics, paint, pulp and paper, and wood products — each producing different influent phenol concentrations and co-contaminants that change the achievable discharge number.
Because the discharge target, not raw removal percentage, is what the regulator enforces, the engineer must work backward from the limit when choosing a process train. A refinery or coker aiming at <1 ppb surface water cannot rely on a single technology with 60–80% removal, while a pharmaceutical plant sending effluent to a municipal plant may meet pretreatment with biodegradation plus adsorption polishing. The rest of this comparison is framed against that discharge target rather than a stand-alone removal number.
Biological Treatment: Pseudomonas, Mixed Cultures and Kinetics
Biodegradation is environmental-friendly and the most common low-cost option for moderate phenol loads, per Applied Water Science (2014). Pure-culture studies reviewed there show Pseudomonas and Acinetobacter degrading 0.8–0.9 g/L phenol, while Klebsiella, Citrobacter and Shigella reach 0.6–0.7 g/L. A binary mixed culture of P. aeruginosa and P. fluorescence achieved 39–80% removal across 100–500 mg/L in batch tests reviewed by Applied Water Science (2014), and treatment above 500 mg/L required acclimatized inocula.
Substrate inhibition is the binding constraint: Applied Water Science (2014) reports no considerable depletion above 300 mg/L initial phenol in the cultures it reviewed, and a maximum degradation rate near 30°C. Practical limits the reader must price in are shock-load sensitivity, long start-up, and the biological waste activated sludge that still requires dewatering and disposal. For a site with stable, low-to-moderate influent and existing activated-sludge infrastructure, pairing an MBR membrane bioreactor wastewater treatment system with a polishing step is the most defensible low-OPEX path.
Adsorption on Activated Carbon, Biosorbents and Chitosan Composites
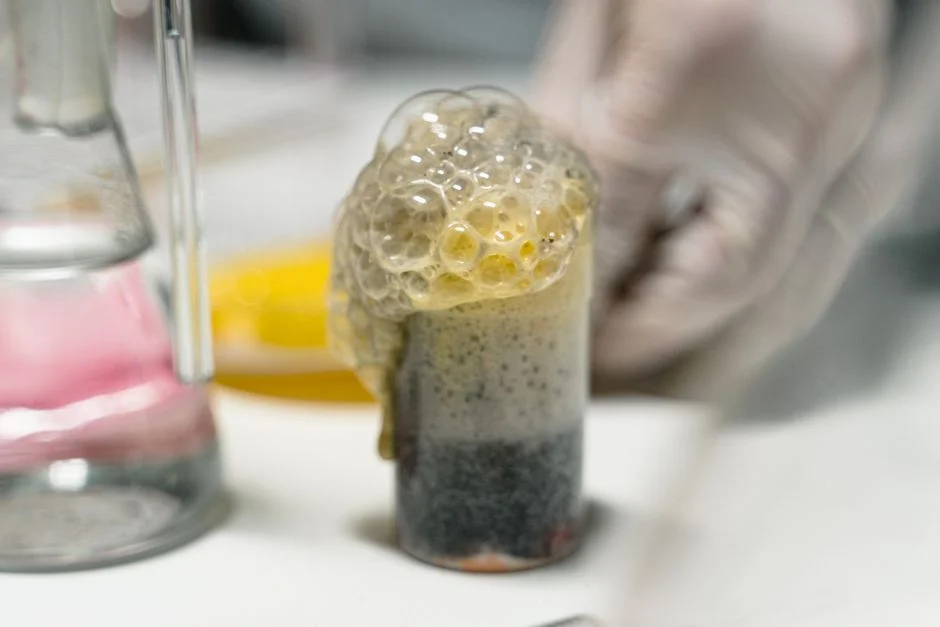
Activated carbon is the most used and a highly efficient adsorption method, but is expensive and drives OPEX through replacement or regeneration, per Current Pollution Reports (2016). The same review reports a pine bark biosorbent reaching 143 mg/g total biosorption capacity at pH 6 with 120 min equilibrium time, demonstrating lignocellulosic waste as a low-cost alternative. A 1:1 activated carbon + chitosan composite reached up to 95% removal of both phenol and Cr(VI) with 40 min equilibrium per Current Pollution Reports (2016).
Iron-oxide-impregnated PAC (IONPAC) maintained BPA adsorption capacity even in the presence of high NOM, with the Freundlich K_F coefficient rising from 94.1 for bare PAC to 119–270 for IONPACs in the studies reviewed by Current Pollution Reports (2016). Spent carbon and saturated biosorbent become a solid waste that often classifies as hazardous, so the reader must account for disposal logistics and consider a media handling program. Replacement cadence and water treatment media and valve components inventory planning should be part of any adsorption-based train.
Solvent Extraction and Cloud-Point Extraction
Liquid-liquid extraction is a standard, non-destructive process for treating phenolic compounds across a wide concentration range, per Current Pollution Reports (2016). Cumene extraction was effective from 50–2200 mg/L in that review's experiments, with temperature adding about 5% removal per 30°C rise, and the process is pH-dependent because phenol ionizes at high pH. Cloud-point extraction (CPE) with 10% Triton X-100 at 90°C removed 66.5% of phenolics from a 9150 mg/L olive mill wastewater feed per Current Pollution Reports (2016), which is a useful reference point for very high-strength streams.
Extraction is non-destructive and enables phenolic recovery, which matters for olive mill, flavor and pharmaceutical streams where the phenol has value. The trade-off the reader must price in: the extractant phase must be separated, regenerated or disposed, and surfactant-laden streams downstream can interfere with biological or membrane stages. For a resin or pharmaceutical plant with a high-phenol front-end, extraction paired with a polishing biological or AOP train is often the lowest OPEX route.
Membrane Processes: NF, RO and Hybrid Trains
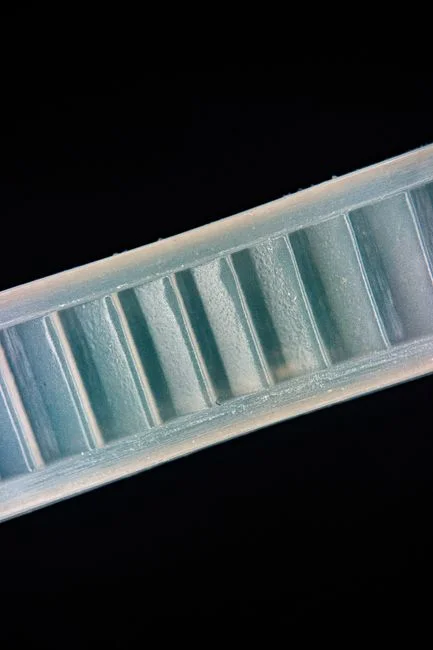
Membrane technologies are reliable, with low power consumption, small footprint and easy scaling through modules, but the dominant risk is fouling from particles and colloids, per Current Pollution Reports (2016). In the Research Square pistachio wastewater study, NF270 alone reached 90.6% total phenol rejection and NF90 alone reached 97.5% on raw wastewater. When that same study paired membranes with pretreatment, totals reached 100% rejection: NF90 with electrocoagulation + UP150 gave 98.6% COD and 100% total phenol removal; NF90 with electrooxidation + UP150 gave 97.9% COD and 100% total phenol.
Current Pollution Reports (2016) recommends placing NF ahead of RO to lower RO operating pressure, and using MF or UF pretreatment ahead of NF/RO to control fouling. The same review names extractive membrane bioreactors (EMBR), photocatalytic membrane reactors (PMR), high-pressure NF/RO/pervaporation, and membrane distillation as the main configurations to evaluate. For a refinery or coker targeting <1 ppb surface water, an industrial reverse osmosis (RO) system downstream of a coagulation or electrocoagulation stage is the proven hybrid to reach non-detect phenol.
Advanced Oxidation: Electrooxidation, Fenton, Ozone and Photocatalysis
Anode material is decisive in electrooxidation: the Research Square pistachio study reports BDD-Pt at 200 A/m² achieving 76.8% total phenol removal, while graphite-Pt at the same current density reached only 57.4%. The same study showed BDD-Pt delivering 61.2% COD removal at 200 A/m² and reaching its best performance (61.2% COD removal) at pH 4.0. Current Pollution Reports (2016) lists the broader advanced oxidation family as electrochemical oxidation, photo-oxidation, ozonation, UV/H₂O₂, Fenton and enzymatic treatment, with each trading reagent cost, energy and safety differently.
Enzymatic (peroxidase) treatment is documented in Applied Water Science (2014) at only 25% removal on a 3.5 mM (~330 mg/L) foundry wastewater feed at pH 7.5 — useful for low-volume specialty streams, not as a workhorse. The practical consequence for the reader: advanced oxidation typically destroys phenol rather than concentrating it, eliminating a spent-adsorbent waste stream but adding electricity or oxidant cost. For a site with no hazardous-waste route for spent carbon, an AOP step removes a downstream disposal liability at the price of higher kWh per cubic meter.
Side-by-Side Comparison: Picking a Method by Influent Band
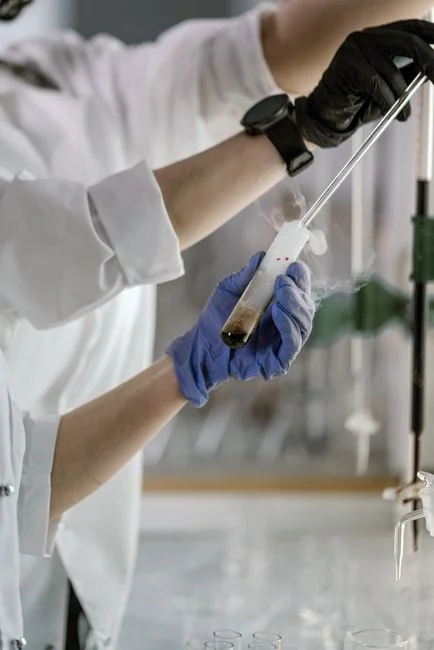
The table below matches the major phenol removal methods to typical influent concentration bands, the secondary waste each produces, and the documented removal range from the supplied research. The reader should treat the bands as a starting point and verify with bench- or pilot-scale data on the actual plant stream before committing to a full design.
| Method | Best influent band (mg/L) | Documented removal | Secondary waste |
|---|---|---|---|
| Biological (mixed culture) | <100–500 | 39–80% (Applied Water Science, 2014) | Waste activated sludge; downstream dewatering required |
| Activated carbon / chitosan composite | Trace–moderate (polishing) | Up to 95% (Current Pollution Reports, 2016) | Spent carbon; often hazardous solid waste |
| Pine bark biosorbent | Low–moderate | 143 mg/g capacity at pH 6 (Current Pollution Reports, 2016) | Saturated biosorbent; disposal logistics |
| Cumene solvent extraction | 50–2200 | Effective across the band (Current Pollution Reports, 2016) | Spent extractant; phase separation step |
| CPE (Triton X-100, 90°C) | High (e.g. 9150) | 66.5% (Current Pollution Reports, 2016) | Surfactant-laden raffinate |
| Chemical coagulation (Al/Fe salts) | Mid | 54–63% total phenol (Research Square, 2020) | Metal hydroxide sludge |
| Electrocoagulation (Al-Al) | Mid | Up to 74.2% total phenol (Research Square, 2020) | Metal hydroxide sludge |
| Electrooxidation (BDD-Pt, 200 A/m²) | Low–mid | 76.8% total phenol (Research Square, 2020) | Minimal solid waste; energy cost |
| NF270 (raw wastewater) | Low–mid | 90.6% total phenol (Research Square, 2020) | Concentrate disposal |
| NF90 (raw wastewater) | Low–mid | 97.5% total phenol (Research Square, 2020) | Concentrate disposal |
| NF90 + electrocoagulation + UP150 | Mid | 100% total phenol, 98.6% COD (Research Square, 2020) | Concentrate + sludge |
| Enzymatic (peroxidase) | Low | 25% at 330 mg/L (Applied Water Science, 2014) | Spent enzyme solution |
For a low load under 100 mg/L and large flow, biodegradation (39–80% per Applied Water Science, 2014) or adsorption polishing with activated carbon or chitosan composites (up to 95% per Current Pollution Reports, 2016) is the typical pattern. For the mid band of 100–1000 mg/L, the Research Square coagulation baseline of 54–63% total phenol removal is usually insufficient on its own; pairing chemical or electrochemical coagulation with NF/RO is the proven path to 100% rejection. For a high load above 1000 mg/L, extraction (cumene, effective 50–2200 mg/L per Current Pollution Reports, 2016) or CPE (66.5% from 9150 mg/L per Current Pollution Reports, 2016) serves as a front-end recovery step, followed by biological or AOP polishing. The sludge burden is the second decision driver: coagulation and electrochemical methods produce a hydroxide sludge that needs dewatering — which is where a dissolved air flotation (DAF) system earns its place ahead of the press — while adsorption produces spent carbon, biological methods produce waste activated sludge, and advanced oxidation produces none.
Decision Framework: Choosing Your Phenol Removal Train
Four steps let the engineer move from a discharge number and an influent band to a defensible process train.
- Fix the discharge target. A surface-water limit of <1 ppb per EPA, cited in Current Pollution Reports (2016), drives hybrid trains with a membrane polish. A drinking-water reuse target of 1 mg/L per WHO, cited in Applied Water Science (2014), may be met with biodegradation plus adsorption polishing.
- Bracket the influent phenol. Below 100 mg/L favors biological; 100–1000 mg/L favors coagulation or electrochemical plus membrane; above 1000 mg/L favors extraction first, then downstream treatment, supported by Current Pollution Reports (2016) and the Research Square pistachio study.
- Check secondary waste. Avoid methods that generate a hazardous spent phase if the site has no high-temperature regeneration or hazardous-waste route. Coagulation, adsorption and biological trains all produce a sludge or solid phase that must be dewatered and disposed.
- Verify fouling control. Any membrane step needs MF/UF pretreatment per Current Pollution Reports (2016) and consistent influent SDI. A multi-media filter ahead of the membranes and an automatic chemical dosing system for pH and antiscalant are the two pieces of unit protection that decide whether an RO train hits its 3-year membrane life or its 18-month one.
Frequently Asked Questions
What influent phenol concentration can a biological system handle alone?
Applied Water Science (2014) reports no considerable depletion above 300 mg/L initial phenol in the cultures it reviewed, and effective treatment above 500 mg/L required acclimatized inocula. A mixed Pseudomonas culture reached 39–80% removal across 100–500 mg/L. For a design review, request bench-scale BOD₅/phenol curves on the actual plant stream before specifying a stand-alone biological train.
Which hybrid train reaches the EPA surface-water target of less than 1 ppb?
The Research Square pistachio study (2020) showed NF90 paired with electrocoagulation + UP150 reaching 100% total phenol removal and 98.6% COD rejection, and NF90 paired with electrooxidation + UP150 reaching 100% total phenol and 97.9% COD. The reader should request a site-specific pilot covering pretreatment, membrane selection and SDI management, and confirm concentrate disposal routing before finalizing the design.
What drives the operating cost difference between methods?
The supplied research does not provide a price comparison. The cost drivers the reader should request from suppliers are: replacement or regeneration cadence for activated carbon and biosorbents, electricity per cubic meter for electrooxidation, sludge dewatering and disposal tonnage for coagulation and biological trains, and membrane replacement frequency under stated feedwater SDI. Each of these maps to a line item the engineering team can price against the plant's actual flow.
How should a buyer select and size a supplier for a membrane-based train?
Ask each supplier for documented rejection data on the target compound (not just generic salt rejection), pilot run results on a sidestream of the actual plant effluent, MF/UF pretreatment recommendations with target SDI, and concentrate handling. For sizing, request the membrane area, flux and recovery at the design feed concentration, and the guaranteed membrane life under stated operating conditions. Cross-check the supplier's numbers against the Current Pollution Reports (2016) review and the Research Square (2020) pistachio data to confirm the proposed train is not over-sized for the influent band.