Why Plywood Wastewater COD Is Hard to Treat
Plywood effluent mixes glue-spreader wash water, dryer condensate, cooling blowdown, and wood-extractives streams, and the resulting pollutant load is dominated by recalcitrant phenol and formaldehyde-type compounds rather than by easily biodegradable organics (Soedarmanto & Setiawati, 2022). A South Kalimantan plywood plant study documented inlet BOD5 of 1,426 ppm, COD of 2,545.7 ppm, TSS of 865 ppm, total phenol of 56.98 ppm, total ammonia of 1,652 ppm, and pH 7.93 (S3).
That profile makes the wastewater behave very differently from a generic food or refinery effluent: the high COD is not "more of the same BOD," and ammonia is high enough to demand a real nitrification step rather than incidental oxidation. Receiving-water monitoring adjacent to plywood plants shows what happens when treatment slips — pH 7.74–7.53, TSS 54–58 mg/L, and COD 14.31–31.53 mg/L were measured in rivers alongside plywood operations in the same study (S3). A design built from standard industrial factors will under-size both the biological block and the polishing adsorber.
Inlet Characterization Checklist for a 2026 Plywood Plant Audit
Before selecting equipment, the engineer needs site-specific numbers — literature ranges only set the design envelope. Across cited plywood studies, inlet values spanned pH 7.81–10.51, TSS 104–241 mg/L, BOD 4.56–17.34 mg/L, COD 9.89–36.82 mg/L, NH3 5.10–46.9 mg/L, and total phenol 6.17–46.46 mg/L (Soedarmanto & Setiawati, 2022). The wide spread means each stream must be characterized separately rather than averaged. The same study reported a BOD5:COD ratio of 1,426 / 2,545.7 ≈ 0.56 on the highest-strength stream, indicating moderately biodegradable organics with a large recalcitrant phenol/fraction that biological treatment alone will not close. Compliance targets should be locked to the local 2026 standard before sizing — the Kep-51/MenLH/10/1995 limits used in S3 (COD 125, BOD5 75, TSS 50, phenol 0.25, NH3 4 mg/L) are a useful baseline, but a stricter provincial regulation may apply.
| Parameter | S3 Inlet (South Kalimantan plant) | Range across cited plywood studies (S3) | Kep-51/MenLH/10/1995 limit (S3 reference) |
|---|---|---|---|
| pH | 7.93 | 7.81–10.51 | 6.0–9.0 |
| BOD5 (ppm) | 1,426 | 4.56–17.34 | 75 |
| COD (ppm) | 2,545.7 | 9.89–36.82 | 125 |
| TSS (ppm) | 865 | 104–241 | 50 |
| Phenol (ppm) | 56.98 | 6.17–46.46 | 0.25 |
| Total ammonia (ppm) | 1,652 | 5.10–46.9 | 4 |
Sample on 24-hour composites and segregate streams — glue-spreader wash water, dryer condensate, and cooling blowdown have different COD:N:P ratios and must not be combined for sizing. Confirm the local 2026 ammonia limit before sizing the biological block; if it is tighter than 4 mg/L, the aeration tank or an ion-exchange polish must be upsized.
Unit Operations in a Proven Plywood Wastewater COD Train
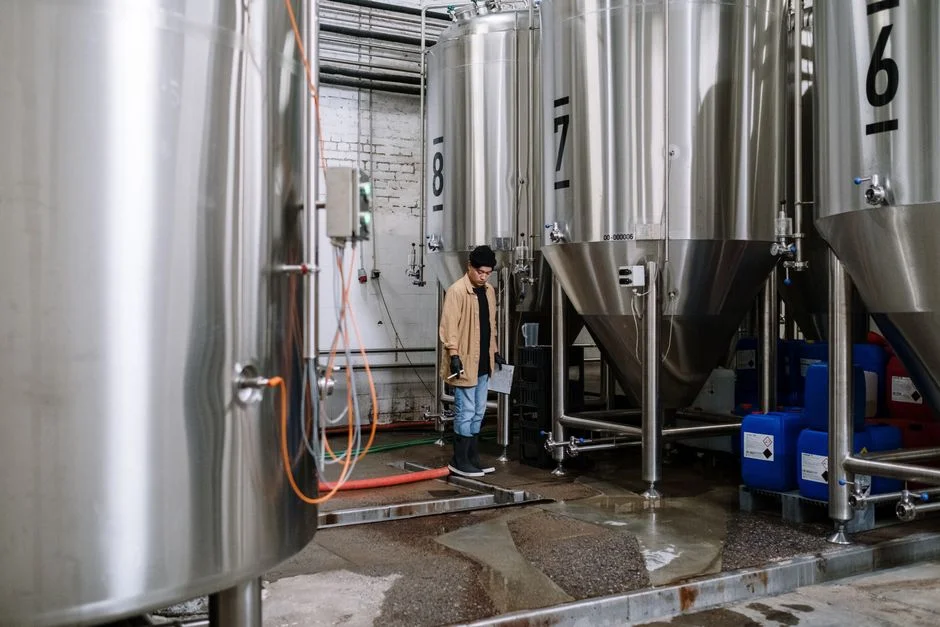
The South Kalimantan train ran sedimentation, coagulation, flocculation, aeration, sand filtration, activated-carbon adsorption, and ion exchange in series, and is the most completely reported dataset in the supplied research (Soedarmanto & Setiawati, 2022). Each stage contributes a measured share, and the dataset shows clearly why no single unit is sufficient. Coagulation alone cut BOD5 by 42.5%, COD by only 19.5%, and NH3 by 39.3% — a necessary but not sufficient step. Adding flocculation after coagulation lifted the same plant to 58.6% COD, 72.5% BOD5, and 68.9% NH3 reduction (S3). Aeration then oxidized the more biodegradable fraction and nitrified ammonia; the full train took total ammonia from 1,652 ppm to 4.56 ppm (99.7%). The polishing block — sand filtration, activated-carbon adsorption, and ion exchange — closed the remaining gap on COD, phenol, and ammonia, with activated carbon credited by the authors with 98.9% TSS and 98.6% COD final reduction due to its "combining force with organic matter" (S3). The final outlet met the Kep-51 reference limits used in the study.
| Stage | Function | Reported contribution (S3) |
|---|---|---|
| Equalization / sedimentation | Stabilize pH, drop settleable TSS before chemical dosing | Start of train |
| Coagulation | Destabilize colloids | 42.5% BOD5, 19.5% COD, 39.3% NH3 reduction |
| Flocculation | Aggregate flocs for downstream separation | 72.5% BOD5, 58.6% COD, 68.9% NH3 reduction |
| Aeration / biological | Oxidize BOD, nitrify ammonia | Drives 99.7% NH3 and 97.9% BOD5 final removal |
| Sand filter | Capture carry-over solids | Pre-polish for adsorber |
| Activated-carbon adsorption | Adsorb recalcitrant COD and phenol | 98.6% COD and 98.9% TSS final reduction (S3) |
| Ion exchange | Final ammonia / trace ion polish | Brings NH3 from biological outlet to 4.56 ppm |
For the highest-strength stream reported, the final outlet was BOD5 30.5 ppm (97.9%), COD 34.7 ppm (98.6%), TSS 9.65 ppm (98.9%), phenol 1.45 ppm (97.5%), and NH3 4.56 ppm (99.7%) (Soedarmanto & Setiawati, 2022). Two implications follow: (1) coagulation and flocculation together are not optional even when a biological block follows, and (2) the polishing block — not the aeration tank — is what brings phenol from tens of ppm down to single digits.
Choosing the Right Primary COD-Removal Technology in 2026
Four primary technologies are credible candidates for the COD backbone on a plywood stream. Each has a defensible role, and the choice should be driven by the actual S3 profile: high COD with a recalcitrant phenol fraction, very high ammonia, and moderate TSS. A side-by-side view helps the engineer decide what to put in front of the polishing block.
| Technology | Strength on plywood matrix | Limit on plywood matrix | Evidence base |
|---|---|---|---|
| Biological (aeration + clarification or MBR) | Drives BOD5 and ammonia down — 97.9% BOD5 and 99.7% NH3 in the S3 train | Leaves COD above typical discharge limits without polishing | Soedarmanto & Setiawati, 2022 |
| Dissolved air flotation (DAF) with coagulant | Established for FOG, TSS, and fiber removal in pulp-and-paper-adjacent streams | Chemical conditioning only; downstream biological block still required | Implicit in S3 coagulation step; standard DAF practice |
| Electrocoagulation | 99.5% COD removal on petroleum wastewater (710 mg/L inlet) with 4 Al + 4 Fe electrodes, 2 cm gap, 12 cm submergence, 10.5 V, 50 min, 0.5 g/L NaCl, ~12 kWh/m³ | Petroleum-matrix parameters — not directly transferable; must be pilot-confirmed on plywood glue-spreader wash water | Muslim & Asel, 2023 (S1) |
| Activated-carbon adsorption | Strong polishing — 80.7% COD reduction reported on a prior 80 cm activated-carbon + quartz-sand media study cited in S3 | Expensive as a sole COD workhorse; carbon life must be confirmed against 56.98 ppm phenol inlet (S3) | Prior study cited in Soedarmanto & Setiawati, 2022 |
The defensible 2026 selection rule: use the biological block to remove ammonia and BOD, use a DAF or DAF system for primary solids and fiber removal in place of plain sedimentation, and reserve electrocoagulation — or activated carbon — for cases where the stream is segregated and the operating parameters can be pilot-confirmed. For more on electrode selection and energy data, see electrocoagulation efficiency and energy data; for a comparison with conventional activated sludge, see MBR vs conventional activated sludge.
Recommended Process Flow for 2026 Compliance
Step 1 — screening and grit removal, to protect downstream pumps from wood fiber and debris. Step 2 — flow equalization with pH trim, to dampen the swings between glue-spreader wash events and dryer condensate. Step 3 — coagulation and flocculation, dosed by an automatic chemical dosing for coagulation and flocculation system tied to flow. Step 4 — primary solids separation, either a DAF system for primary solids and fiber removal or a lamella clarifier for primary settling where the stream is low-FOG. Step 5 — biological aeration, sized for the 1,652 ppm ammonia reported in S3; use an MBR for the biological COD and ammonia block if footprint is constrained. Step 6 — sand filter, to protect the carbon bed. Step 7 — activated-carbon adsorber, the polishing workhorse credited in S3 with the final 98.6% COD reduction. Step 8 — ion exchange or breakpoint chlorination for ammonia if the local 2026 limit is tighter than 4 mg/L, rather than oversizing the aeration tank. The S3 outlet versus Kep-51 reference is the design target: COD 34.7 vs 125, BOD5 30.5 vs 75, TSS 9.65 vs 50, phenol 1.45 vs 0.25, NH3 4.56 vs 4 (Soedarmanto & Setiawati, 2022).
Sizing and Supplier-Selection Checklist
Procurement should refuse vague "typical removal" claims and demand guaranteed outlet numbers on a sample of the plant's own glue-spreader wash water, with the residence time, current density, or carbon contact time stated explicitly. For the biological step, request the design F:M ratio and SRT used to hit a sub-4 mg/L NH3 outlet on a 1,000+ ppm ammonia feed, as in the S3 plant (Soedarmanto & Setiawati, 2022). For activated carbon, request the empty bed contact time (EBCT) and the expected carbon life in months against the 56.98 ppm phenol inlet in S3. Insist on a documented sludge-handling path: S3 did not quantify sludge mass, but a 865 ppm TSS feed followed by coagulation and biological treatment will generate a meaningful cake that must be dewatered — a plate-frame filter press sized to the calculated dry-solids load is a defensible baseline. For the equalization and primary steps, a lamella clarifier for primary settling is one of the practical choices for retrofitting into an existing civil footprint.
Frequently Asked Questions
What is a typical inlet COD for a plywood or LVL mill?
The South Kalimantan plant study reported an inlet COD of 2,545.7 ppm on its highest-strength stream, while broader plywood literature in the same paper showed a range of 9.89–36.82 mg/L (Soedarmanto & Setiawati, 2022). The actual design value must be measured on 24-hour composites of segregated streams rather than borrowed from a literature range.
Can biological treatment alone meet plywood discharge limits?
Not on the streams reported in S3. The biological block in the South Kalimantan train is what drove BOD5 to 30.5 ppm and ammonia to 4.56 ppm, but the full train still required coagulation, flocculation, sand filtration, activated-carbon adsorption, and ion exchange to bring COD from 2,545.7 to 34.7 ppm and phenol from 56.98 to 1.45 ppm (Soedarmanto & Setiawati, 2022).
What does a 2026 plywood wastewater treatment system cost?
The supplied research contains no capital or operating cost figures for a plywood train, so no defensible number can be quoted here. A buyer should request line-item CAPEX and OPEX — including chemical dosing, carbon replacement, and sludge dewatering — from each shortlisted supplier, each tied to a guaranteed outlet on the plant's own wastewater.
What should a plywood mill demand from a treatment-system supplier in the RFQ?
The RFQ should require guaranteed outlet values on the mill's actual glue-spreader wash water, the F:M ratio and SRT used to meet the local ammonia limit, the EBCT and expected carbon life at the plant's inlet phenol concentration, and a documented sludge-dewatering path with a plate-frame filter press sized to the calculated dry-solids load. For a related case study on selection criteria, see electrocoagulation for industrial COD removal.